High Temperatures
These are the High temperatures for the last few months, and the orange dots show when we've set a recent record - either the warmest or coldest temperatures since 1996 (which is when the records begin for the current Blatchford weather station).
This May we set 8 recent records for warmest-Highs. We didn't set any all-time records though, and the closest we got was 30.2°C on May 23rd compared to 31.1°C which was set way back in 1886.
Thinking back a month, in April we set 1 recent warmest-High as well as 5 coldest-Highs. And that included 1 all-time coldest High on April 5th at -8.8°C. So things certainly turned around over the last month.
When we dig into the numbers a bit, this May had 23 days which hit 20°C, and that included 13 days of 25°C or more. That's a lot.
Last May we had 7 25°C days, and 2015 and 2016 both had 6, but in the recent years before that we were averaging 1 or 2. Before this year the most 25°C days ever recorded in May was 9, and that happened in 1884, 1894, 1897, 1928, 1934 and most recently in 1961.
For a bit more context, 13 25°C days isn't just a lot for May. In June we average 6 25°C days, in July we average 11, and in August we average 10.
And as we saw in Edmonton's Hottest Days we've now had 3 Mays in-a-row with a 30°C day, when more typically that would only happen once every 3 or 5 years.
Low Temperatures
For the Low temperatures we set 4 recent records, and that included 2 all-time warmest-Lows on May 8th and May 24th.
This May we didn't have any Lows below freezing, and we didn't in 2017 either. That's still fairly unusual though, as we saw earlier in Frost-Free Days.
Warm & Cold Months
This chart looks at the overall average temperature each month (the average of all of the daily Highs & Lows) in comparison to the 20th century average for the month.
With this very warm May we were 4.6°C above the 20th century average for May, and 3°C warmer than the recent average. That follows a cold February, March and April.
No Snow!
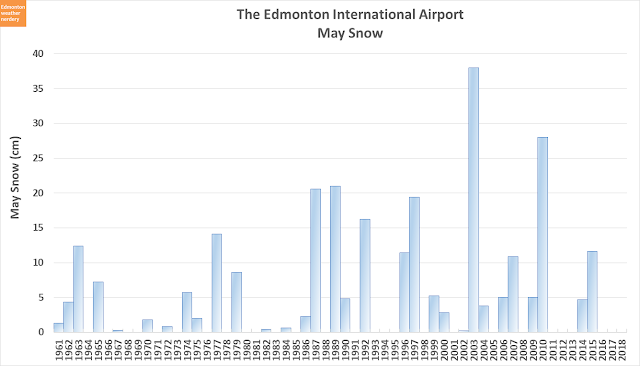
We didn't get any snow this May, and so it's probably safe to say that we're done for the winter of 2017-2018. That leaves us with:
- Above average - September, October, March
- Below average - December, May
- Average~ish - November, January, February, April
It's worth pointing out though, that the the International has had snow once in June, with 1.4cm on June 6th 2011.
The International has now gone 3 Mays in-a-row with no snow, from 2016-2018. That also happened in 2011-2013 and 1993-1995, but the Airport has never had 4 Mays in-a-row without snow. So lookout, 2019! (although in 1980-1985 it went 6 years with only a tiny bit)
The total snow for the winter of 2017-2018 is 116.9cm. Our average each winter is about 125cm, so this year was a bit below that, and was 20cm below the 136.7cm that we had in 2016-2017. Two years ago the winter of 2015-2016 was very low, down at 53cm.
Precipitation
And now is the part of the year where we get to put away the Snow charts, and switch over to Precipitation. So far in 2018 the International has been close to average, while Blatchford has been a bit low.
When we look at the cumulative total precipitation for 2018 the International has had 114.6mm so far, compared to 72mm at Blatchford. At this point in 2017 the International was way up at 189mm.
We are just getting into our monsoon season though, and that's when things usually take off:
June Temperatures
Normally June is warmer than May, but that will be a tough trick to pull off this year. As we saw earlier this May had 13 25°C days, and the only recent Junes which matched that were 2002 and 2016. And May had 23 20°C days, and only 2002, 2015 and 2016 matched or exceeded that.
So even though things have cooled off, May really gave us a bonus month of summer. Hopefully everyone was able to enjoy it.
To end things off, here are the May, June and July temperature tables for an easier comparison:


