2017/10/30

Halloween 2017

I feel like we took a pretty thorough look at Halloween weather last year, so I won't rehash that again.

As a reminder though, here is Edmonton's history of October 31st temperatures:


Last year's post has all of the details, but notably:
  • The average temperatures for Halloween recently have been a high of 5°C and a low of -3°C, and the forecast for 2017 is calling for something very close to that.

  • 1981 was really warm, and 1984 was really cold

  • The years when Edmonton most consistently had snow on the ground for Halloween were actually from 2001 to about 2006 (although those records only go back to 1960)

2017/10/24

How Warm is 2017 - the Months

A few weeks ago we looked at how 2017's temperatures compared to other years, in How Warm is 2017? (October Edition). And ultimately we ended up with this:

Comparison of 2007 through 2017

So far 2017 has been fairly warm compared to other recent years, coming in behind 2012, 2015 and 2016, but above all of the rest.

Today we're going to break that down further to see how the individual months compare. This is mostly just an excuse to try out a new chart, so here we go:

Warm and Cold Months

This chart looks at how warm each month of each year was, compared to the average for that month during the 20th century. This uses the mean daily temperature again, rather than the highs or the lows

It rushes through all of the years pretty quickly, but I hope it gives a sense of how things bounce around. Most years have some warm months and some cold months, and that was even true 130 years ago. The balance of warm vs. cold has changed over time though, and with the dotted grey line we can see how the 5-year average moves around.

In a few weeks I'll do a separate post which takes a closer look at some of the more interesting years from this chart. For today though, we're going to stick with recent history.

2017

Here's the chart for 2017, so far. The bars shows how many degrees we were above or below the 20th century average, and the dotted grey line shows the 5-Year average.

Looking at January, this year our mean daily temperature averaged -8.1°C, which is 5.4°C above the 20th century average of -13.5°C. And at the other end, in September our average temperature of 15.6°C was 4.8°C above the 20th century average of 10.8°C. Most of the other months were a couple of degrees warmer than the 20th century, except for the slightly cool March and April.

Looking at the 5-Year average, most months in 2017 have matched it fairly closely. The two biggest gaps were March which was almost 2°C below the recent average, and September at almost 3°C above.

2016

Here is 2016 as another quick comparison. We can see how consistently warm it was from January through September, before temperatures took a nosedive in October, and then shot up again in November.

2010-2017

To get a bit more of a sense of recent history, this chart cycles through 2010-2017.

Most of the years here have a mix of warmer-than-typical and colder-than-typical months. 2012 had a cold October-December, followed by a warm January-February 2013. 2014 had a warm January, but then a cold February through May. 2015 was notable for having all 12 months on the positive side of the 20th century average.

5 Year Average

One final, new chart today, which focuses on how the 5-year average changes over time.

In previous posts we've looked at the fact that Edmonton's temperatures in the winter are more variable than in the summer, and we see that again here. If you watch the 5-year average line for summer months you'll see that the line is very constant. From 1880-2017 it stays in a narrow band within +/- 2°C of the 20th century average. Right now that average is at the very top of its range, following a series of relatively warm summers.

The average for the winter months fluctuates much more, with a range of +/-8°C. For January and February our recent average is again near the top of the range, but for November and December we've actually stayed pretty close to the 20th century average.

And that's it for today. At the end of every month I find myself saying "April was cold" or "September was fairly warm." The charts today let us actually compare each month to recent years, and to longer-term history.

When talking about monthly average temperatures we lose track of the extremes, though. It's important to remember that even in a "warm" month or a "cold" month that the temperatures often bounce around a lot:

2017/10/10

First and Lasting Snowfalls

We got a bit of snow on the weekend, and there's snow in the forecast again, so it's time to take another look at when Edmonton typically gets "lasting" snow.

Today is going to be a bit of a repetition of some posts from last winter, where we had looked at Edmonton's first snowfall of each winter and when snow starts to hang around.

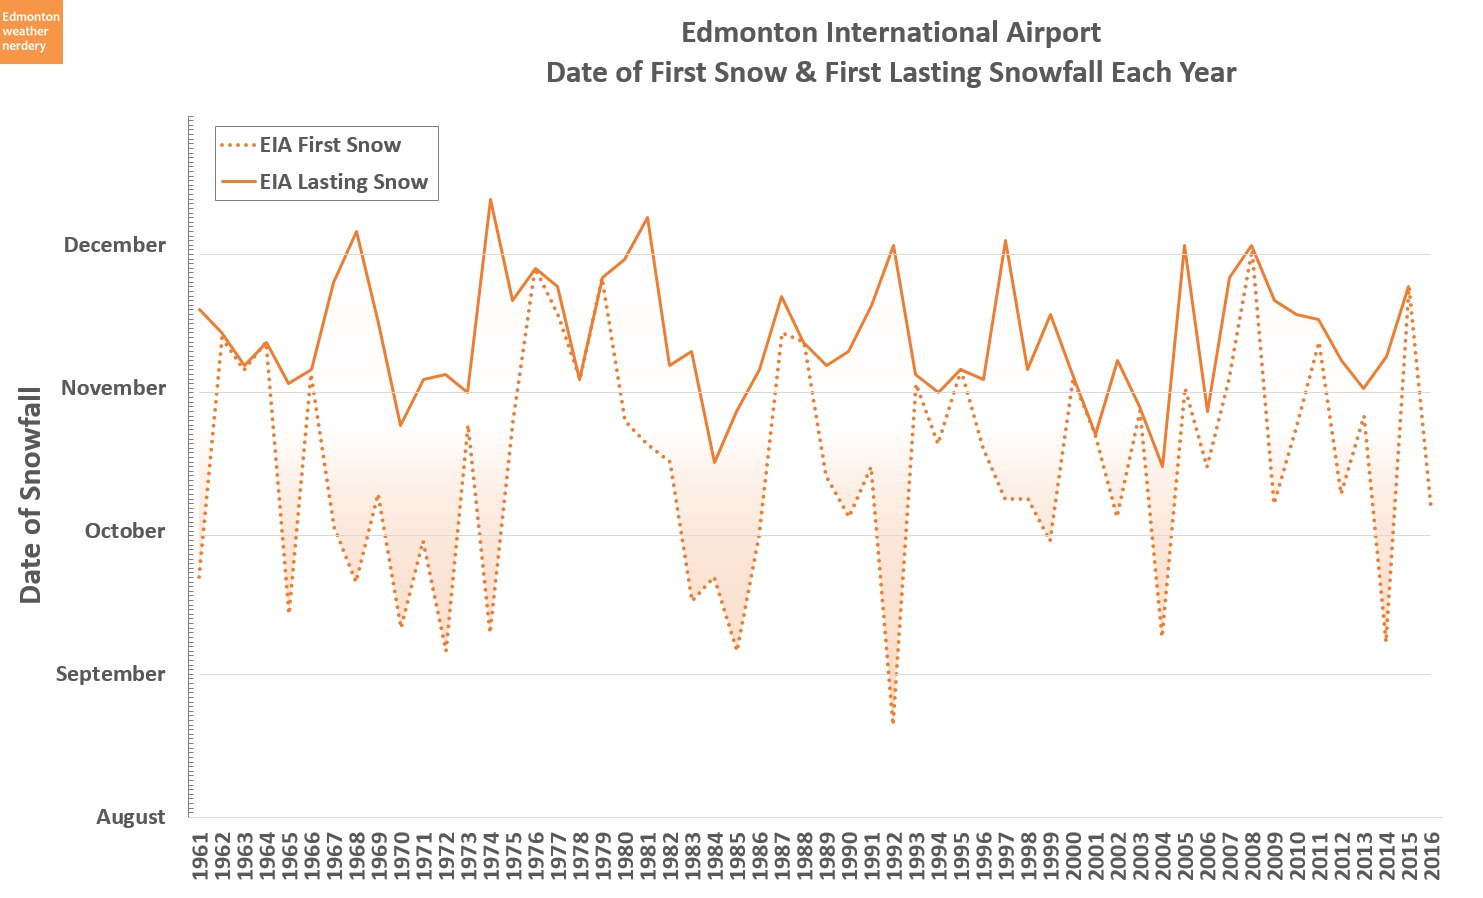
Here's the chart from last year:

First Snowfall versus Lasting Snowfall

With the dashed-line in this chart we can see that the first snowfall usually happens between mid-September and mid-November. In 1992 the airport even recorded 2cm of snow on August 21, but that was unusual. When we get early snowfalls in September and October (or even August) they usually melt-off quickly.

The solid-line in this chart shows when we start to get lasting snow, which is when the airport has a measurable depth of snow on the ground. That doesn't usually happen until mid-October at the earliest, and about half of the time it's mid-November or later.

There have been a few years in which the first snowfall was quickly followed by lasting snow, but sometimes they can be separated by a month-and-a-half. And for the August snow of 1992, the lasting snow didn't arrive until more than 3 months later at the beginning of December.

All of that is covered in greater detail in the original posts, but I always felt like this chart was missing part of the story. So this year I want to try something a bit fancier:

First Snowfall versus Lasting Snowfall - Version 2

This chart starts with the same basic idea - the difference between the first snow and lasting snow. But this also shows all of the individual snowfalls that occur from September 1 through December 31.

The dots in orange are for snow that melts, and the blue dots are for when it starts to stick around. The size of each dot corresponds to the amount of each snowfall, and anything greater than 0.1cm is included here, so some of these are very small.

What I like about this busy animation is that we can see how snow becomes more frequent as we move from fall into winter. In September the dots are rare, but around mid-October they start to appear more often. Things pick up at the start of November, and then by mid-November the snow just explodes.

Recent Years

Simplifying things a bit, this is the same chart showing only the recent years from 1995-2017 (and one version with the animation, and one without).

Since 1995 snow in September has only happened 3 times - in 2004, 2014, and then this year we got a bunch.

And lasting snow has only shown up before Halloween 6 times - in 1995, 2000, 2003, 2004, 2006 and 2013. We looked at Halloween last year and saw that 2000-2006 were the peak years of snowy-Halloweens in Edmonton, which was a bit unexpected.


This chart shows how first snow and lasting snow breakdown by week.

For first snow, in recent years the most common weeks have been the 2nd and 4th of October. The rest of the years are spread out from the 2nd week of September all the way through the 1st week of December.

For lasting snow the 4th week of October and 3rd week of November have been the most common, each with 5 years. Broken out by month, lasting snow has happened in October 6 times, November 13 times, and then 3 times in December. In total though, it means that since 1995 lasting snow hasn't shown up until after Halloween 72% of the time.

Picking the exact date of "lasting" snow is a bit tricky, but it goes back to this chart:

Winter Tire Countdown

As someone who bikes all winter, the question of when to switch to studded tires is important. I never want to do it too early, because then I might be stuck on loud, slow, bumpy tires for a month longer than necessary. But I also don't want to leave it too late, because a surprise night of freezing-rain can make the morning ride really awkward. It's the same basic idea as switching to winter tires for the car, but you really feel it on a bike.

As this chart shows, every year is a bit different and there is no right answer to the question of winter tires. It's easy to panic when snow falls in October, although usually we still have a few more weeks before winter really hits. Things almost always take-off by Mid-November though, so by then there probably isn't much point in putting things off any longer.

We'll end things off today with two caveats:
  • the data here is for the International Airport, because Blatchford's snow records aren't great. We looked at the discrepancies between the stations in this post last year, and have also looked at the International's cold temperatures. In most years the snow at the two stations was close, but sometimes there are differences. Notably, last winter the airport had a large storm on November 15th, but it missed the city and we were snow-free until about December 3rd. 
  • when early snow melts-off, it might leave some remnants behind. Last spring we looked at what "0cm" of snow actually looks like, and after a large fall snowstorm the measurements might say that we're snow-free, even though there is still some snow left in the shade, or under trees, or piled up.
So there is some approximation in these charts today, but early-to-mid November seems to be roughly the point where winter typically arrives in Edmonton.

2017/10/09

Thanksgiving Weather

We're near the end of Thanksgiving weekend, so it's time to see how 2017 compared to other years.

Temperatures

As I'm writing this, the final High for Thanksgiving Monday hasn't been recorded yet. But so far Friday was warm at 16°C, Saturday was cooler at 10°C, and Sunday reached 7°C. The average High is 12°C, and the average Low is 1°C, so this year we're right around where we would expect to be,

2016 was a cold Thanksgiving, with all 4 days down around freezing. And 2015 was a warm one, with all four days above 15°C, and the Saturday all the way up at 26°C. 2014 was quite warm too, with all four days above 15°C.

Taking the average temperatures across the entire weekend, the warmest recent Thanksgiving was 2010, which had 3 days above 20°C. The coldest was 2009, with the Highs for all four days below freezing.

Precipitation

In this chart we have we have Thanksgiving precipitation at the Airport, and it isn't very common.

The standout is obviously 1998, with 2.6mm of rain and 15.6cm on the Friday. And then last year in 2016 we had a total of 12.5cm of snow spread across the 4 days.

In 2017 we had 0.2mm of rain on Saturday, and then 0.4cm of snow on Sunday.

2017/10/03

How Warm is 2017? (October Edition)

Last year at the end of August we looked at how warm 2016 was compared to other years. At that point 2016 was in a commanding lead as Edmonton's warmest-recorded year. But then things cooled off a bit through the fall, and by the end of December 2016 had finished in 3rd place.

Today we're going to see how 2017 compares, now that we've reached the end of September (I'd planned to do the end of August again, but got sidetracked).

To start off with, a bit of a recap:

Edmonton's Warmest and Coldest Years

This chart shows Edmonton's warmest and coldest years, going back to 1880. It takes the average daily temperature for each year, and compares that to the average for the 20th century. Warmer years are shown in orange, and colder ones are in blue.

2016 is in third place on the far right, and across the entire year the daily average temperature was about 3°C warmer than the average for the 20th century. 2017 isn't included in this chart because it isn't finished yet, and comparing a partial-year isn't fair to all the rest.

If you are interested in more background on the chart, the original explanation is here.

The Horserace

This chart shows where those year-rankings come from, broken down to a day-by-day basis. The full explanation of it is here, but each year gets its own line, and days that are warmer than the 20th century average drive that line up, while colder days drop it down.

It gets pretty messy as all of the years pile up, so to get a better look at 2017 we'll just focus on recent history:

2007-2017

Here we have the lines for 2007-2016 shown for some context, and then all the older years are simplified into the orange, white and blue quartile ranges in the background. 2017 appears in red.

As of September 30, 2017 is sitting well below where 2012, 2015 and 2016 were at this point in the year, but it's above all of the other recent years.

Anytime that the 2017 line dips down - like at the beginning of January, February and March, and then late-April and then mid-September - that's a coldsnap. And any sharp jumps upwards are the warmspells. Digging into the numbers a bit, at the end of September we are 274 days into the year, and 2017 has racked-up 561 "points" (a point is basically one °C above the 20th Century average). That works out to an average of 2°C warmer each day than the 20th Century average.

In comparison, at this time last year 2016 was at 1018 points, or 3.7°C above the average. But then the cool fall and winter dropped 2016 to 2.9°C. In terms of rankings, the last 10 years range from 2016 in 3rd-warmest to 2009 down at 69th.

Top 10 Years

Here we have the same thing, except that this chart compares 2017 to Edmonton 10's warmest years rather than to the last decade. At this point of the year 2017 is about tied with where 6th-place 1976 was. But there are still three months left in 2017, and there's no telling where it will end up.

High Temperatures

This chart shows the High temperatures for 2017 so far.

2017 has broken 4 all-time records for highest temperatures: on February 15, May 5 and then last month on September 7 and 11. It also broke 17 other recent warmest-Highs (going back to 1996), and 7 recent coldest-Highs.

The sections in red and dark-blue show how much time we've spent above or below the recent average. With that, it's easy to see the coldsnaps we had in early January, February, March, and then for most of April. We can also see how much September fluctuated: two all-time records, then two cold weeks, and then a warm week to end things off.

Low Temperatures

The Low temperatures are similar, with the coldsnaps in January, February and March showing up again.

So far 2017 has had 6 all-time record warmest-Lows, on May 5, June 8, August 23 & 28, and September 8 & 27. And then there are 17 other recent warmest-Lows, and 4 recent coldest-Lows.

Precipitation

And finally, here we have the Precipitation for 2017 so far.

The 2017 precipitation for both of Edmonton's main weather stations is shown here, with the International Airport in Blue and Blatchford dotted-in in Red. The reference range in the background - the green and grey and yellow areas - is all based on data from the International Airport's for 1995-2016. Blatchford is missing data for several of those years, so that is why the International is used here as the reference instead.

At the end of September the International had recorded 442mm of precipitation compared to only 344mm at Blatchford, for a difference of almost 100mm. That difference mostly happened during the summer months, with Blatchford's July and September precipitation well below the International's. Last year we had looked at how similar the precipitation between the two stations typically is, and a 100mm difference between the stations isn't unprecedented, but it's definitely on the high-side of things.We'll check in again once the year is over.

So that's the scorecard so far for 2017: fairly warm, but nothing like 2015 or 2016; and precipitation at the International is a bit above average, while Blatchford is a little bit below.

2017/10/01

September Review / October Preview

September Highs

September temperatures were really a rollercoaster this year, setting 2 all-time records on September 7 and September 11, and then plunging down to a recent coldest-High on September 13. We started with roughly 2 really warm weeks, then had 2 really cold weeks, and ended the month on the warm side again.


With an average High temperature of 18.8°C, this September was about middle-of-the-pack. (and it just edged-out 1917, which had an average of 18.5°C)

It did have one day above 30°C - which is only the 3rd time that's happened in the last 20 years - and there were a total of 5 days above 25°C and 15 days above 20°C. But it also 4 days that didn't reach 10°C, and that's not unusual, but it is on the cooler side of things.

Just looking at the colours in this table, the heatwaves at the beginning of the month show up as the darker-reds, and the group of chillier days in the middle of the month are the more faded orange.

September Lows

As per usual, the Lows follow the Highs. We broke 2 records for all-time warmest-Lows on September 8 and 27, following the 2 records that were broken in August. 4 all-time records in 2 months might sound like a lot, but we took a closer look at that a few weeks ago in: How Often Does Edmonton Break Temperature Records?

The 0.9°C Low on September 15 was the coldest-Low on that day since 1995.


The average Low was 7.2°C which is pretty typical. About half of the time September will record some Lows below 0°C, but that didn't happen this year. The closest we came was 0.9°C on September 15.

Precipitation

Here we have the precipitation for the month, and with 66mm at the International Airport this September was well above the average.

In comparison this is another month where Blatchford was substantially below the International, recording only 45mm. So far in 2017 the International has recorded a total of 442mm of precipitation, while Blatchford is almost 100mm less at 344mm

This chart also shows 2016's precipitation for comparison, and it had a dry September with only 22mm, but then an above-average October at 37mm.

Snow

It feels strange to be talking about snow already, but I guess it's time.

In September 2017 the International recorded 8.4cm of snow, which is more than in any other year since 1995. The only other recent years with snow were 1999 with 2.4cm, 2004 with 5cm, and more recently 2014 had 4.4cm. Luckily September snow always disappears fairly quickly.

This chart also shows the snow from last winter, and there was no snow in September of 2016, but October 2016 had quite a bit with 22cm.

October Temperatures

As we head into October, things are going to cool off.

In September we had 15 Highs above 20°C, but in October about half of the time there won't be any. We'll definitely see some overnight Lows below 0°C and probably below -5°C. And about half of the time we'll see some daytime Highs that don't even break above the freezing mark - in recent years 2012 was the extreme example of that, with 10 daytime Highs below 0°C.