In August we spent most days above the average. We came close to some recent temperature records on the 23rd and 27th, but fell short both times. And aside from those two days we didn't come close to any extremes.
With an average High of 24.1°C, August 2017 was on the warmer side of things. We didn't have any days above 30°C, but there were 14 days above 25°C and 27 days above 20°C, and those are both tied for second-most since 1998.
August Lows
We didn't break any record Highs in August, but there were a few lows. On August 23 and 28 we set two all-time records for warmest-Lows, and August 30 was a recent record. And on August 21st we set a recent coldest-Low at 6.5°C.
With an average Low of 11.6°C, August 2017 was right in the middle of the pack. We didn't have any nights below 5°C, and only one night above 15°C. Most of the month stayed above 10°C, which is pretty typical.
Precipitation
With 38mm of precipitation at the International, August was a bit below average, but was about half of what we got in August 2016.
In July we looked at the large difference in precipitation between the International and Blatchford - 90mm vs 49mm. In August that gap dropped to 7mm, with Blatchford at 31mm.
September Temperatures
In September things will cool off a bit. The chances of a 30°C day are pretty slim, with only 2009 and 2011 having any days that warm. We'll still probably get a week-or-two above 20°C, but days above 25°C will be rare enough that they're worth celebrating. In the chart above the red and dark-reds have disappeared a lot, compared to what we saw in August.
For Low temperatures about half of the time we see some nights below freezing, but most will probably be between 5°C to 10°C.
Monthly Scorecard
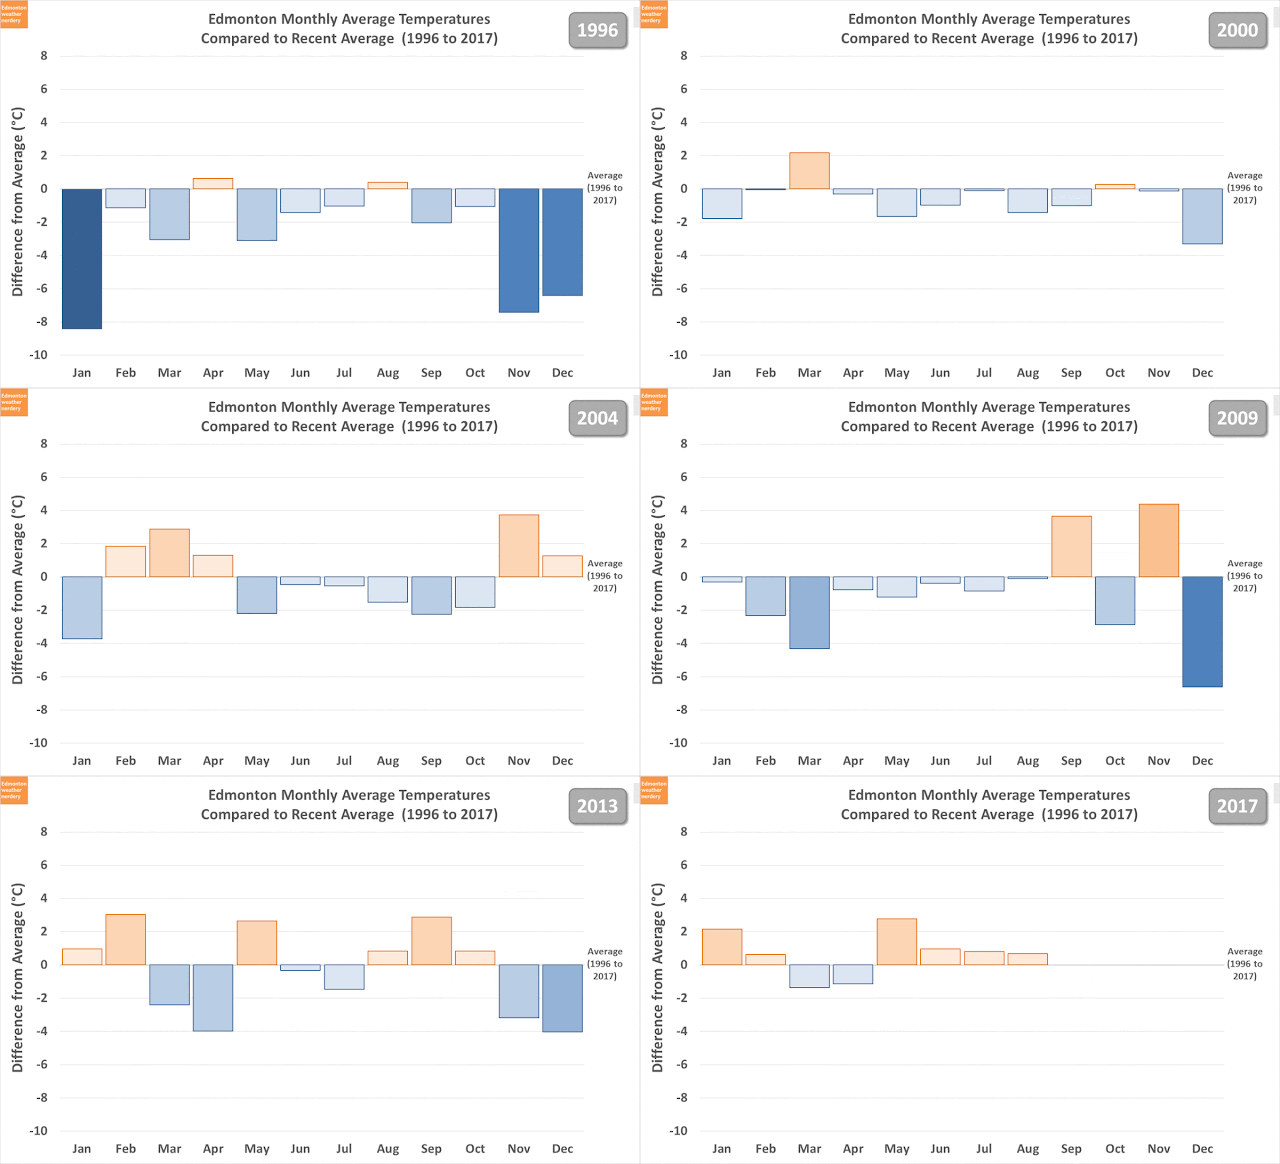
To end things off, here's a new chart which is an attempt to show how each month of the year compares to the recent average based on 1996-today. This uses the mean daily temperature, so it's a combination of the High and the Low. I'll probably play around with this more in the future, but for now it gives a sense of how things can vary throughout a year.
For 2017 both March and April were cool, and each day averaged a degree-or-two what we'd seen recently. January and May were both a few degrees above average, and all of the other months were just a bit on the warm side.
This chart flips by pretty quickly, and I'll take a closer look at it in a week or two. One thing to watch for though, is the difference between the summer and winter months. We've seen before that our temperatures in the summer are very consistent compared to the winter. That shows up again here, with the summer months being a degree or two from the average, compared to some January's and Decembers which averaged 8°C or 10°C difference.


No comments:
Post a Comment