2017/09/27

Broken Records - Part 2

Today is going to be a bit of a continuation of the last post, where we had looked at how often temperature records are broken in Edmonton. Today we'll focus in a little bit on the High Temperature records that are either a lot colder or a lot warmer than their neighbours.

To start things off, here is our temperature breakdown for the year:

Yearly Temperature Breakdown

I use this chart a lot, and it shows the average temperature for each day of the year in white, and then in orange a blue are the range of temperatures that we've seen since 1996. The lines furthest out from the average are the all-time warmest and coldest records. Today we'll be looking at the all-time warmest.

Records Compared to their Neighbours

In this chart the focus is on the all-time warmest Highs. It shows each of the records in orange, and then the average for each 7-day period appears in black. The gap between the two is highlighted in red or blue.

There's quite a bit of variation between the records, with plenty of gaps of 3°C or 4°C above or below the average for the week. It's worth keeping in mind just how far above the typical temperatures (visible faintly in white) all of these records are. In the summer the records are all about 10°C above the daily average, and in the winter they're more than 15°C.

In terms of Standard Deviation, there are 30 records here between 1.1-1.5 standard deviations, and 10 that are over 3. Most records are in the range of 2-2.5 standard deviations from the average temperature for their respective days.

Top 10 Warmest Records Compared to Neighbours

Here we have the same chart, but this time the 10 highest gaps are shown.

This year on February 15, 2017 we set a new High temperature record of 16.4°C. In comparison, the records for the rest of that week range from 10.6°C for February 14 and 17, up to 13.3°C for February 16. So the record that we set this year was 4.6°C above the average of its neighbours, which makes it the 4th largest gap.

The largest gap was on December 27, 1999 which set a record of of 16.1°C, which was 6.1°C above it's neighbours.

The oldest extreme record here was set on March 23, 1889, at 22.2°C. 128 years later that record is still 4.8°C warmer than the average of the other records for that week.

These records obviously aren't unbreakable, but they are so much warmer than their neighbours that it might be awhile before they fall. Next we'll take a look at the records that are a bit more vulnerable.

Top 10 Coldest Records Compared to Neighbours

Here we have the low-hanging fruit, with the 10 records that are the furthest below their neighbours.

The most under-achieving record is 13.6°C set on March 24 2004, which is -4.8°C below the average for its neighbours. And we just looked at March 23, 1889 with an over-achieving record of 22.2°C. Between those two days - March 23 and 24 - there is a difference of 8.6°C between the records. Again though, it's import to remember that these are both record High temperatures, and that 13.6°C on March 24 - while low - has never been broken. In comparison, the average High for that time of year is about 6-7°C.

Oldest Records

Last week I'd mentioned that Edmonton has one unbroken High temperature record which goes all of the way back to December 12 1880, at 10.6°C. This chart shows that records, along with the 27 other records which were set in the 1880's.

You might expect that the reason these records have never been broken is because they were all really high, but that's not actually the case. About half of these 120+ year-old records are above their neighbours and about half are below. The December 12, 1880 record is a degree below the average for that week, but on the other hand the March 22 record that we just talked about is 4.8°C above its neighbours.

Last time I'd said that breaking a temperature records always seems like something momentous, and today we've seen that some records are more momentous than others.

2017/09/12

How Often Does Edmonton Break Temperature Records?

Today we're going to look at how often temperature records are broken in Edmonton.

This week we set a new all-time High on September 11th at 29°C. Last week we set another one on September 7th at 32.2°C, and earlier this year we broke other records on May 5th at 28.9°C, and on February 15th at a scorching (for February) 16.4°C. Four all-time records in one year might sound like a lot, but in 2016 there were 7, and in 2015 there were 5.

One caveat today is that Edmonton has had 3 different weather stations since 1880, and the data varies a bit between them. We looked at the stations here, and saw that the current station often measures temperatures about 0.5°C colder than the previous station did. Normally that's not a big deal, but when we're talking about breaking records even 0.1°C can make all the difference.

So the thing to keep in mind today is that this is more for the sake of trivia than for any great insight.  There is a lot of chance involved in breaking a record, because it's often just a matter of being at the right place at the right time.

Now lets look at some charts:

High Temperature Records Broken Each Year

This chart shows each day of the year along the bottom, and along the side is the year when a new High temperature record is set. When an old record is broken it fades into the background as a grey dot.

Environment Canada's temperature records start in 1880, and during the first few years basically every day was a new record. By the time we reached 1900 things had settled down to about 20 records per year, and from the 1950s onwards the average has been about 4 per year. As we move further along it theoretically gets harder to set new records, because there's more data to compete with.

Recent (2000-2017) High Temperature Records

Here's a closer look at the records which have been broken since 2000.

In 2000 and 2010 we broke 0 records, while 2002 and 2016 both broke 7. It's pretty typical to break 3 or 4 records per year, and so far in 2017 we've broken 4.

Long-Standing High Temperature Records

The earlier charts showed how often records are broken, but this one shows the records that are still standing, and how long ago they were set.

Edmonton has one unbroken High temperature record which goes all the way back to December 12 1880, with a High of 10.6°C. And of the 366 days of the year, 45 of these records were set prior to 1900. Most decades claim about 25 records, but the 1930s hold 49. The 2010s aren't over yet, but so far we're at 24.

Years with Most High Temperature Records

And finally, here are the the years which hold the most High temperature records.

1889 and 1934 have the most records right now, with 10 each. 1910 has 9, 1981 has 8, and then 1936, 1939, 2002 and 2016 all have 7.

So that covers the warmest-High temperature records. Next we're going to flip things around to look at the coldest-Lows.

Low Temperature Records Broken Each Year

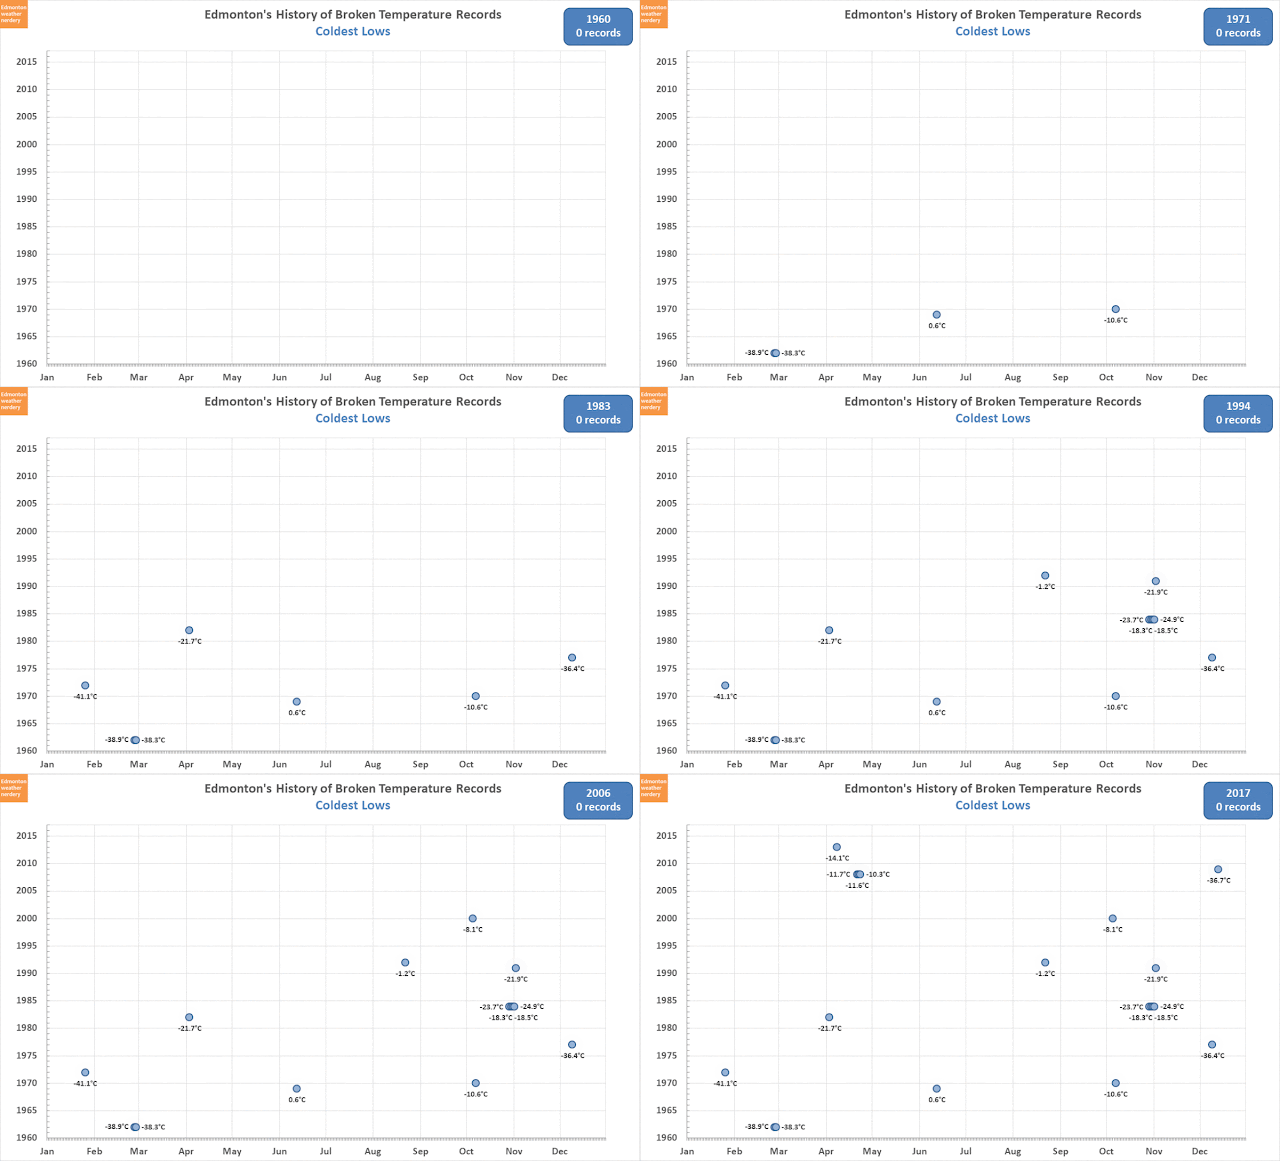
Here we have the history of broken records for coldest Low temperatures. It looks quite a bit different from what we saw for the warmest Highs, because after about 1960 the broken records get pretty sparse.

"Recent" (1960-2017) Low Temperature Records

This chart shows all of the Low temperature records which have been broken since 1960, and there are only 19 of them.

Probably the most notable record here was -36.7°C on December 13, 2009, because on that day the Edmonton International also recorded a temperature of -46°C. And that inspired a number of "coldest place in Canada" headlines, and it continues to inspire a number of "Edmonton's winter is 8 months of solid -75°C!" anecdotes.

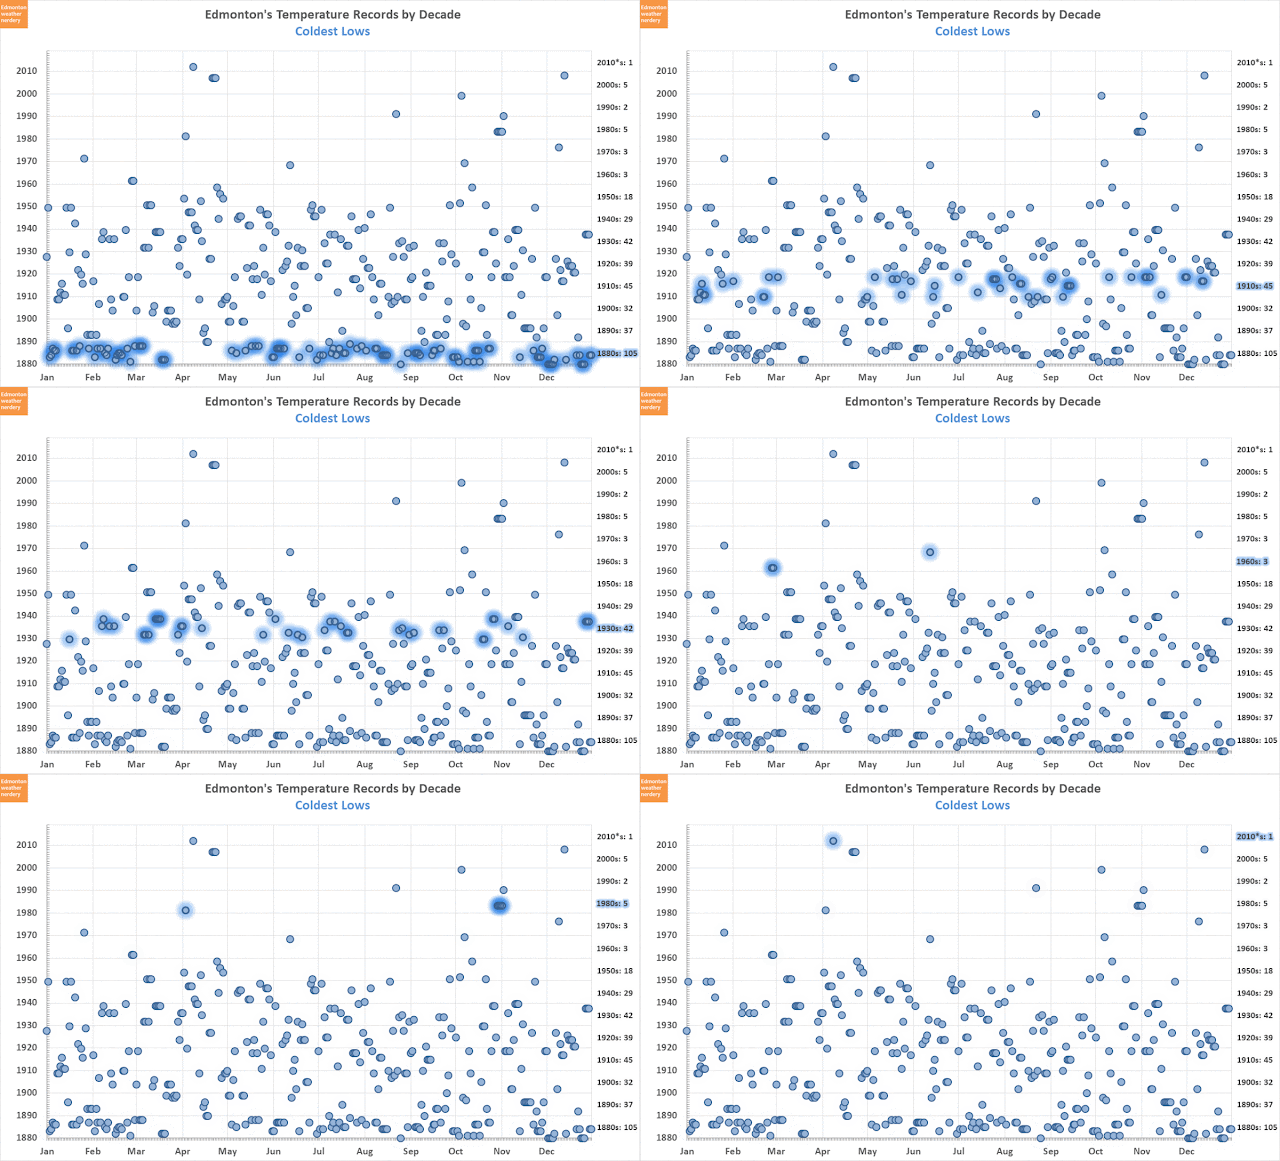
Long-Standing Low Temperature Records

If we breakdown our Low temperature records by decade, more than 90% of them were set before 1950, and one quarter of them were set in the 1880s. So far in the 2010s we've only set the one, on April 8 2013 at -14.1°C.

There are two other types of temperature records that we haven't looked at yet: coldest-High and warmest-Low. For the sake of completeness we'll take a quick look at those too.

Coldest High Temperature Records

We just saw that we don't break records for coldest-Low very often anymore, but coldest-Highs are a bit more common.

In the last few years we've set records for coldest-Lows on September 8 2014 at 3.8°C, April 30 2013 at -0.2°C, July 22 2011 at 12.6°C, and May 22 2010 at 6°C. None of those were during the winter though, so they might not seem too extreme.

Probably the most notable recent record was December 13 2009, with a daytime High of -28.3°C. That's the same day that had the record-setting Low of -36.7°C, which we had looked at earlier.

Warmest Low Temperature Record

And finally, here is how the records are spread out for our warmest-Lows. Earlier we saw that for the warmest-Highs we break about 3-4 records each year, and for the Lows it's a little bit more frequent sitting in the 4-6 per year range. So far in the 2010s we've set 41 warmest-Lows, compared to 24 warmest-Highs.

The most notable thing about these records is probably the giant gap highlighted below:


For June through October, almost all of the temperature records for warmest-Low were set after 1950. The other records we've looked at today were spread out fairly evenly, going back to the 1880s. But for the warmest-Lows during the summer months there are only about 8 remaining records which were set prior to 1950.

One final piece of trivia is that the current record warmest-Low for July 22 was set in 1880, at 20.6°C. The records in Edmonton started on July 11, 1880, and so that one was set in week #2, and it hasn't been broken since.

That's it for today's look at temperature records. When we break a record it always seems momentous, but it actually usually happens a handful of times each year.

2017/09/11

Record Watch - September 11

And another record today:


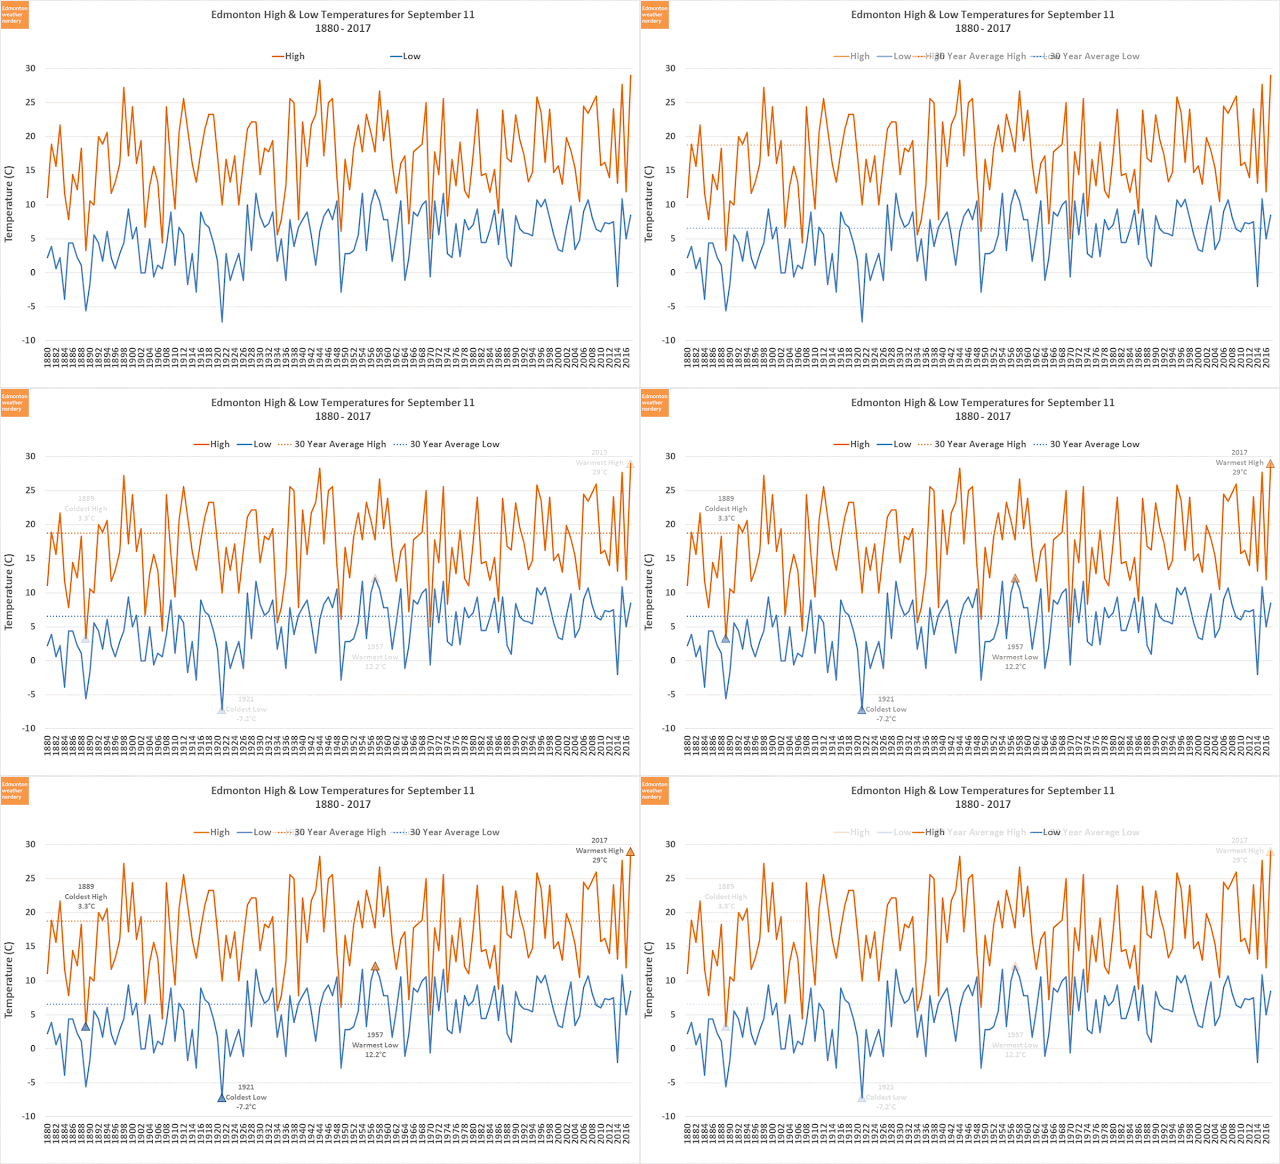
Environment Canada recorded 29°C today, making this Blatchford's warmest September 11. The previous record was 28.3°C set in 1944.

In the last few years thing have swung wildly: from 14°C in 2012; up to 24.1°C in 2013; down to 13.2°C in 2014; up to 27.7°C in 2015; way down to 11.9°C in 2016; and now back up to 29°C this year. The 30-year average for September 11 is a High of 19°C and a Low of 7°C.

2017/09/09

September Heatwave Recap

Our heatwave is taking a break for at least a few days, so here's a quick look back:

50 Warmest Temperatures for September 4th through 10th

Here are the 50 warmest temperatures for this week of the year, going back to 1880.

This year we have had 3 days in the Top-50, with September 5th at 27.5°C, the 6th at 29.3°C, and the 7th at a record-breaking 32.2°C. And that means the 2010s have 10 days in this Top-50, moving past the 1930s and 1940s which both have 8.

September 7th

The 32.2°C on September 7th beat the previous record of 30.6°C from 1909.

32.2°C also made this one of the warmest September days ever recorded in Edmonton. September 7 2017 ties for 5th-warmest September day, with September 3 2009:

Warmest September Temperatures
Rank
Date
High
1st
September 1, 1967
33.9°C
2nd
September 17, 1981
33.6°C
3rd
September 23, 2009
33.2°C
4th
September 9, 1981
32.9°C
5th
September 3, 2009
32.2°C
5th
September 7, 2017
32.2°C

2017/09/06

Record Watch - Early September

It looks like we're in for a few warm days, so lets take a look at some other warm, early-Septembers.

50 Warmest Days

Here are the 50 warmest temperatures (56 days, because there's a tie) for the week of September 4-10, going back to 1880.

Looking at things by decade, so far the 2010s have 8 days in this list, including 4 warm days in 2011. The ties the 1930s and 1940s, and the 2010s still have a few years to go.

The records for this week are all above 30°C, with the exception of the 10th at 28.9°C. The warmest temperature ever recorded during this week of the year was 32.9°C, on September 9, 1981.

September 6th

The forecast for September 6th is 29°C, and that's warm, but it's no threat to the record of 31.1°C set in 1934. It would be about on par with the 28.9°C recorded in 1980.

September 7th

Right now the forecast for September 7th is 33°C, and if that happens it would be enough to break the record of 30.6°C which was set back in 1909. 2003 and 2011 both broke 29°C, but 1909 is the only time September 7th has broken 30°C.

Just about a week ago on August 30 we also had a forecast of 33°C, but that day ended up being really hazy, and didn't actually manage to break 25°C. We'll have to see what tomorrow brings.

2017/09/05

Labour Day Weekend 2017

Temperatures

The Labour Day weekend this year was a pretty nice one, with 3 days above 20°C, including Saturday which hit 25.5°C. Sunday was down at 18.6°C, but that was still warmer than any of the days from the 2015 or 2016 long weekends.

Looking at many of the other years here, 2017 is pretty typical. But because 2014-2016 were all on the cool side of things, this year was the warmest Labour Day weekend that we'd had since 2013.

Precipitation

And in terms of precipitation, both Blatchford and the International recorded 0.6mm of rain on the Saturday, which is barely worth mentioning compared to some of the other recent years.

2017/09/01

Labour Day Weekend

Lets take a look back at Labour Day temperatures:


The last two Labour Day weekends have not been warm. 2015 and 2016 both reached scorching Highs of 16.4°C on the holiday Monday, with the rest of the days below 15°C, and one of 2015's Highs was even down at 8.2°C. Those weren't the coldest recent Labour Day weekend though, because that honour goes to 2000 which didn't have any days above 15°C.

More typically, the average daytime High for the weekend is 19°C, and we usually get some days above 20°C. 25°C is pretty rare though, with only 5 of the last 22 years breaking that barrier. The overall warmest Labour Day weekend since 1995 was 2013, helped mostly by some very warm overnight Lows.


As far as precipitation goes, 2015 was really rainy, and 2016 was pretty rainy and it even recorded a bit of snow (0.4cm at the International Airport, but nothing in the city).

Most of the recent Labour Day weekends have received at least some precipitation - only 1995, 1998, 1999, 2006 and 2010 were completely dry.

August Review / September Preview

High Temperatures

In August we spent most days above the average. We came close to some recent temperature records on the 23rd and 27th, but fell short both times. And aside from those two days we didn't come close to any extremes.


With an average High of 24.1°C, August 2017 was on the warmer side of things. We didn't have any days above 30°C, but there were 14 days above 25°C and 27 days above 20°C, and those are both tied for second-most since 1998.

August Lows

We didn't break any record Highs in August, but there were a few lows. On August 23 and 28 we set two all-time records for warmest-Lows, and August 30 was a recent record. And on August 21st we set a recent coldest-Low at 6.5°C.


With an average Low of 11.6°C, August 2017 was right in the middle of the pack. We didn't have any nights below 5°C, and only one night above 15°C. Most of the month stayed above 10°C, which is pretty typical.

Precipitation

With 38mm of precipitation at the International, August was a bit below average, but was about half of what we got in August 2016.

In July we looked at the large difference in precipitation between the International and Blatchford - 90mm vs 49mm. In August that gap dropped to 7mm, with Blatchford at 31mm.

September Temperatures

In September things will cool off a bit. The chances of a 30°C day are pretty slim, with only 2009 and 2011 having any days that warm. We'll still probably get a week-or-two above 20°C, but days above 25°C will be rare enough that they're worth celebrating. In the chart above the red and dark-reds have disappeared a lot, compared to what we saw in August.

For Low temperatures about half of the time we see some nights below freezing, but most will probably be between 5°C to 10°C.

Monthly Scorecard

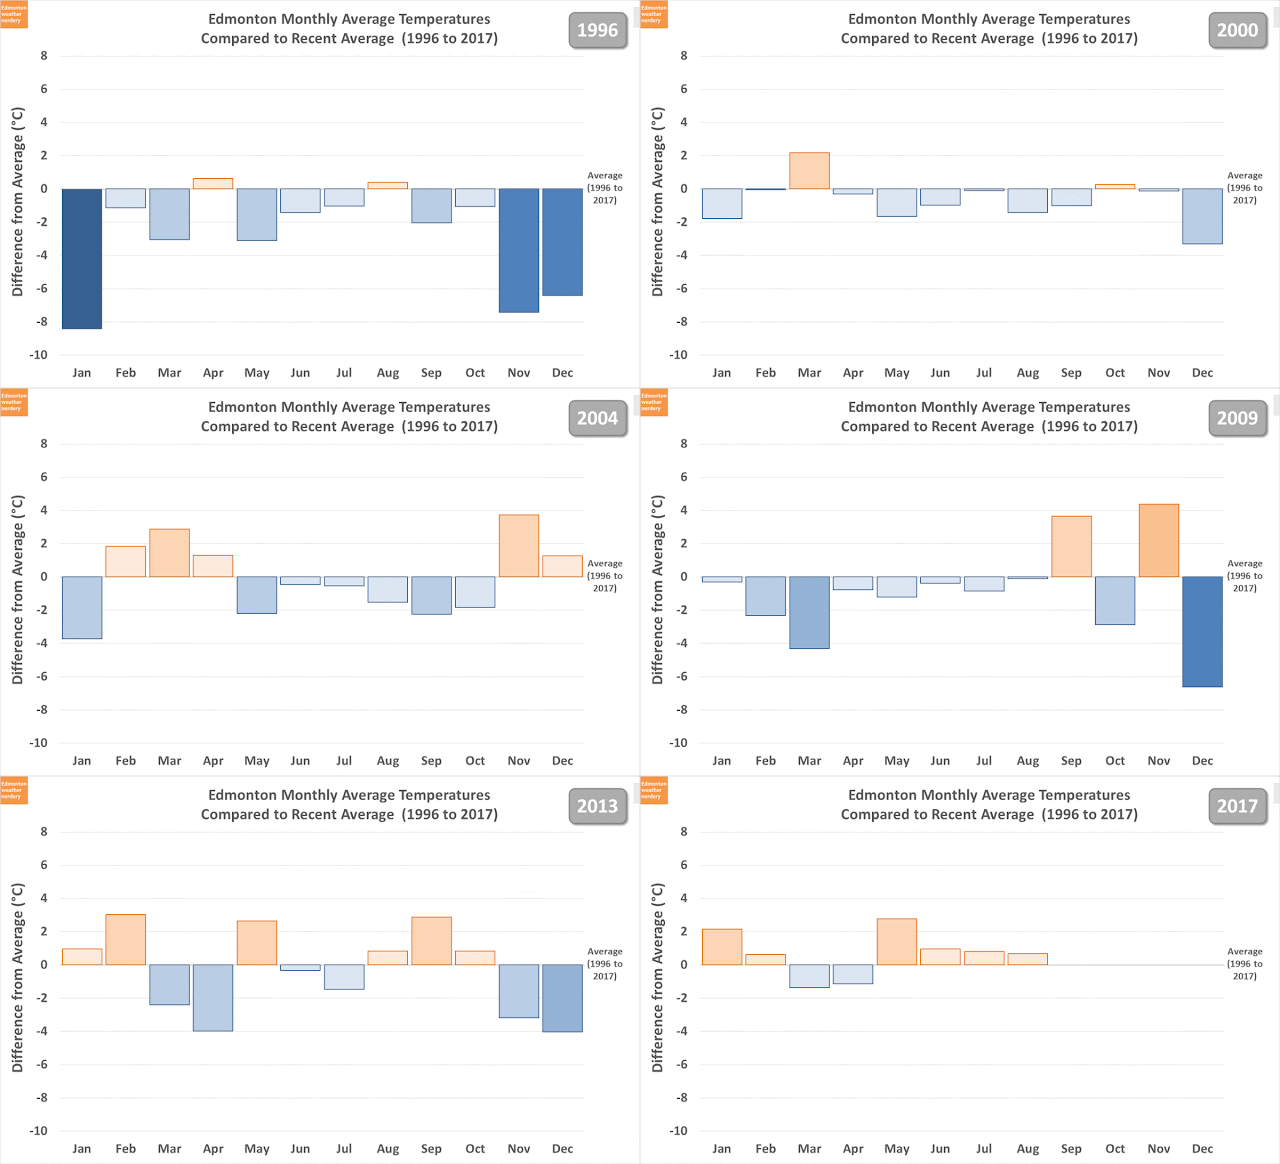
To end things off, here's a new chart which is an attempt to show how each month of the year compares to the recent average based on 1996-today. This uses the mean daily temperature, so it's a combination of the High and the Low. I'll probably play around with this more in the future, but for now it gives a sense of how things can vary throughout a year.

For 2017 both March and April were cool, and each day averaged a degree-or-two what we'd seen recently. January and May were both a few degrees above average, and all of the other months were just a bit on the warm side.

This chart flips by pretty quickly, and I'll take a closer look at it in a week or two. One thing to watch for though, is the difference between the summer and winter months. We've seen before that our temperatures in the summer are very consistent compared to the winter. That shows up again here, with the summer months being a degree or two from the average, compared to some January's and Decembers which averaged 8°C or 10°C difference.