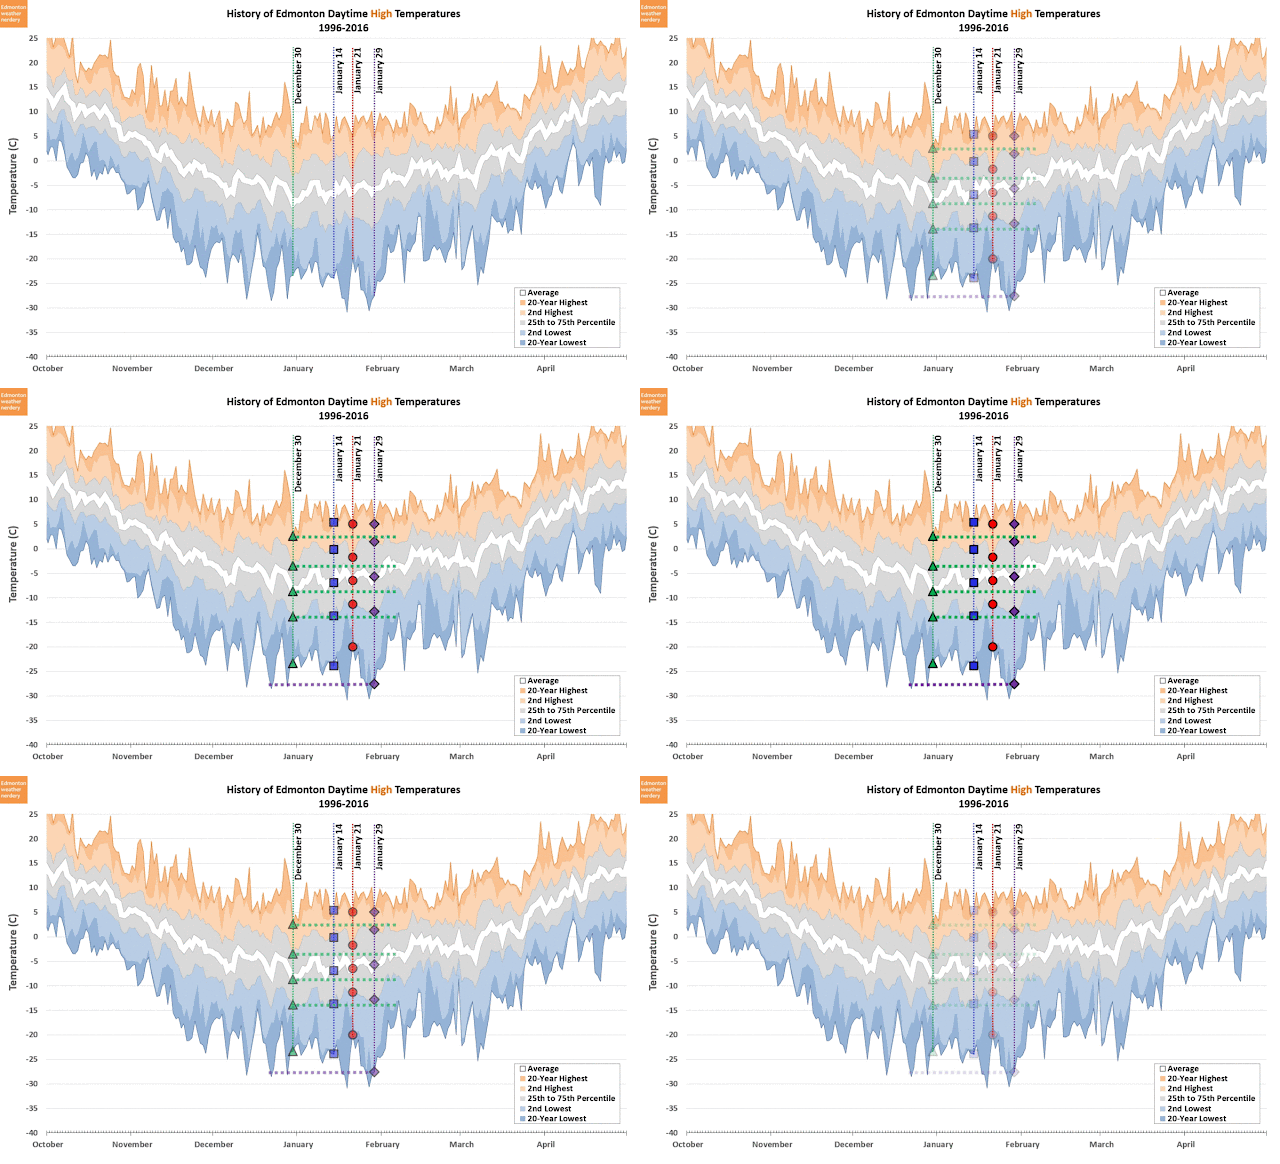
And last week the CBC posted a story - Winter is leaving, for some of us - which said that January 14 is the point where Edmonton's temperature "begins its slow, relentless rise to what we call the dog days of summer."
Today we're going to take a closer look at that, because in the winter it's actually a little tough to pick out where exactly that turn-around point happens. In summer Edmonton's temperatures hit a nice peak, but in the winter it's more of a wide valley.
Daytime Highs
Here I've identified 4 dates that we might want to call the low-point for the year. We have December 30 with a green triangle, January 14 a blue square, January 21 a red dot, and January 29 a purple diamond. I wouldn't actually have picked January 14th, but it's the "official" date, so I figured it should be included.
This chart shows the distributions of the daytime High temperature at Blatchford for the last two decades. It has the average temperature, the 25th & 75th percentiles (the range where temperatures will fall about half of the time), and the warmest & coldest days since 1996.
For each of those temperatures the green triangles for December 30 are the lowest, except for coldest-since-1996 which goes to January 29.
So most of the time our daytime High temperatures actually do level-off around New Year's. If we line up all the points on the chart we can see that by mid-to-late January the average and quartiles are several degrees warmer than they were at the end of December. But then occasionally the end of January does surprise us with very cold temperatures (those very cold January temperatures on this chart were mostly during two specific coldsnaps in 1996 and 2004, which we looked at here).
Daytime Lows
The Lows are a little bit less clear-cut.
The average Low and the 75th-percentile bottom out around December 30th. as we saw with the Highs. The warmest-since-1996 turns around on January 21st. And the 25th-percentile turns around on about January 29th, and that's about where the coldest-since-1996 does too. The "official" date of January 14 is right in the middle of all that, but it's actually a little bit warmer than all the others.
So depending on how you want to define things - between the Highs and Lows, and the averages and percentiles and etc. - we've either just about reached the very deepest part of winter, or we actually passed it a few weeks ago. Or maybe more accurately, winter pretty much stops getting colder around New Year's, but then it doesn't genuinely start warming up again until near the end of January.
If the idea that winter flatlines for an entire month is a bit depressing, Winnipeg and Montreal offer an alternative:
Here we have the average Highs for Winnipeg and Montreal, which both have a more distinct turn-around-point in late-January than Edmonton does. But that means that their temperatures keep dropping for most of the month, instead of settling down at New Year's like in Edmonton (and Calgary too).
Because of that, Winnipeg's early-winter is pretty much the same as Edmonton's, while it's late-winter is much colder. And Montreal's early-winter is warmer than Edmonton's, but it's late-winter is pretty similar.
And we see the same thing with the Lows. Winnipeg and Montreal distinctly turn around in late-January, but at that point the average temperatures are about 5°C colder than they were in December.
It's kind of nice to know that on average, by New Year's day Edmonton's winter has usually thrown its worst at us. And sure, it hangs around down there for a month before things start to warm up again, but that sounds preferable to an extra month of falling temperatures.


No comments:
Post a Comment