2017/01/31

January Review / February Preview

With the start of a new month, it's time to look back at January.

January High Temperatures

January 2017 was pretty warm, but nothing particularly unusual.

We had 8 days above 5°C, and in the last 20 years that ties for first place with 2014. For total days above 0°C we had 12, which is on the high-side of things, but is below years like 2015, 2014, 2012 and etc. We had no highs below -20°C, and below -15°C we had 4, and that's a little on the low-side.

I've talked before about the reliability of January not-chinooks, and we had two nice ones this year. In the chart above they show up in orange, right at the middle and end of the month.


This is just another perspective of the temperatures over the last few months.

December had fluctuated between very cold and pretty warm. That carried into January, which started out pretty cool, but then warmed way up near the middle of the month. We set one recent record with a high of 7°C on the 29th, and got close to a few in the middle of the month. We didn't set any all-time records though.

Compared to last winter, January 2017 was actually a little warmer than January 2016. But last January was really the only "typical" month last winter, and after that the temperatures took off. We can see that in this chart, with the dotted line for February and March of 2016 being well above the average.

January Low Temperatures


The lows are pretty unexceptional, with the average low of -13°C and 8 days below -20°C putting us right in the middle of the pack.


For the lows we can again see the swing between coldsnaps and warmspells. In January we didn't come close to any recent lows, but we did have 4 warmest-recent-lows during the warmspells. Again though, no all-time records.

Snow

In terms of snow, the International airport recorded just over 10cm, which is about half of the average, and a pretty close match to what we got in November.

February Temperatures


Looking forward to February, we can see that on average about half of the days in the month will break 0°C.

The chances of a coldsnap or two are pretty good, with most years having at least a few lows below -20°C. Highs below -20°C are pretty rare though, with only 3 of the last 20 February's having any days that stayed that cold.

February is also typically the least-snowy winter month, averaging about as much as we just got in January.

3d nerdery

Finally, here's a fun topographical representation of the last 20 years of daytime Highs for January and February. (and to get this to animate cleanly I have to cheat a bit, so this is actually only the first 29 days of January)

I'm going to play around with this more in a few weeks, but just for now, what stands out is the deep canyons of January. Late-December and early-January are when we're most likely to get our deepfreezes, and those show up here as deep, darkblue sections. February isn't much hotter than January is, but it is less extremely-cold, and because of that it's 3d profile is a lot more flat and less variable.

2017/01/23

Warmspells

Last week in Edmonton we had a nice, little, don't-call-it-a-chinook. It melted a lot of the snow (not that we've had very much this winter), and we got close to a few records, but as I've said, it wasn't particularly unusual. And although the temperatures have cooled off a bit this week, the forecast is predicting that we'll be up above freezing again soon.

A few weeks ago we'd looked at our winter coldsnaps - how often they happen, and how long they last. Today we'll do the same thing for our mid-winter warmspells.

Winter High Temperatures

Here is a chart of daytime high temperatures for the last 6 winters - the oranges are temperatures above freezing, and the blues are below. I'm going back to 2010-2011 with this because we've seen that it was a particularly cold winter, especially compared to 2015-2016 which was very mild.

So far for 2016-2017 we've had a very warm November, but then most of December and January were fairly cold. We've only popped up above freezing for a few days in December, and then again last week.

Highs Above 0°C

Here the days above 0°C are highlighted, and I've added numbers to count the length of each warmspell:

  • A lot of these warmspells are only 1 or 2 days long, so the labels get pretty cluttered. To clean that up I've animated it, which hopefully makes the longer warmspells a little bit easier to spot.
  • I haven't counted the lengths of any warmspells that are right at the start of November or the end of March, because that's really the point were we're transitioning into and out of winter.
The 7-day warmspell that we just had was fairly typical, because each of the last 6 winters has had at least one 5ish day warmspell in January or February. The winning mid-winter warmspell was 2014-2015 with a 12-day streak at the beginning of January. And by the time we move into March streaks of 10 or 15 days become more common.

We can also see how the years vary in terms of warm days. Of the roughly 150 days from November through March, 2011-2012 and 2015-2016 both had 90 or more days above freezing, 2010-2011, 2012-2013 and 2013-2014 were all down around the 50-day mark though, and 2014-2015 had 72.

Highs Above 5°C

In the middle of the winter any day that's above freezing can be nice, but we don't get much melting unless we're above 5°C, so that's what we're looking at here.

Again we see a lot of 1 and 2 days streaks spread throughout the winter. The 4-day streak that we just had is a little on the long side of things, but every year here except for 2012-2013 had a 3 or 4 day streak in January or February. And of the 33 winter months that are shown here, there were only 4 that had no days above 5°C: December 2010, December 2012, February 2014, and December 2016.

Normally the theme of this blog is something like "Edmonton's winter: it's warmer than you think." And while I do generally believe that sentiment, it is a little interesting to see 2012-2013, and to realize that for 5 entire months there were only 16 days that actually broke 5°C. That's on the low side of things compared to the other winters, but still. Our December-February really isn't that bad, but a cool November and March can sure make things long.

When looking at winter I'm never sure if I should use November and March or not, but I wanted to include them here today because I'd also used them when looking at coldsnaps:

Warmspells and Coldsnaps

So here we have a comparison of our warmspells (High above 0°C) and coldsnaps (Low below -20°C). And for the most part we do have a lot more days above 0°C than below -20°C. Although the cool winter of 2010-2011 did come very close to parity.

Time Between Warmspells

Finally for today, we'll take a look at how long we have to wait between warmspells.


This chart shows the longest gap in each winter without a day above freezing.

In 2010-2011 we went 38 days - from November 27 through January 3 - without a high of 0°C. And at the shorter end of things, in 2011-2012 we never went more than 8 days without a high of 0°C.

More typically, in each winter there will be at least one 2~3 week stretch where the temperatures don't warm up to freezing.

For the sake of trivia, Edmonton's longest-ever recorded stretch of days that didn't reach 0°C was 83, from November 11, 1955 through February 1, 1956.


And here we have the longest gap each winter without a 5°C day.

In the deepest, darkest depths of winter we might sometimes wait 2~3 weeks for a 0°C day, but for 5°C it's more like a month-and-a-half. Again, this just shows the longest gap each winter, and there are certainly shorter ones as well. But for each of these winters except 2011-2012, there was at least one extended period without 5°C - usually in late-November through early-January.

Edmonton's longest-ever recorded stretch of days below 5°C was probably 116 days, from November 8, 1978 through March 3, 1979. I say "probably" because there are two stretches in 1887 and 1993 that might be contenders, but they're both missing quite a bit of data. In recent memory, November 13, 2007 through February 14, 2008 was a 93-day stretch where the temperature never reached 5°C.

2017/01/18

Are we there (the middle of winter) yet?

Last summer I'd said that July 22 is basically the day that Edmonton's temperatures turn around and start heading downhill towards winter.

And last week the CBC posted a story - Winter is leaving, for some of us - which said that January 14 is the point where Edmonton's temperature "begins its slow, relentless rise to what we call the dog days of summer."

Today we're going to take a closer look at that, because in the winter it's actually a little tough to pick out where exactly that turn-around point happens. In summer Edmonton's temperatures hit a nice peak, but in the winter it's more of a wide valley.

Daytime Highs

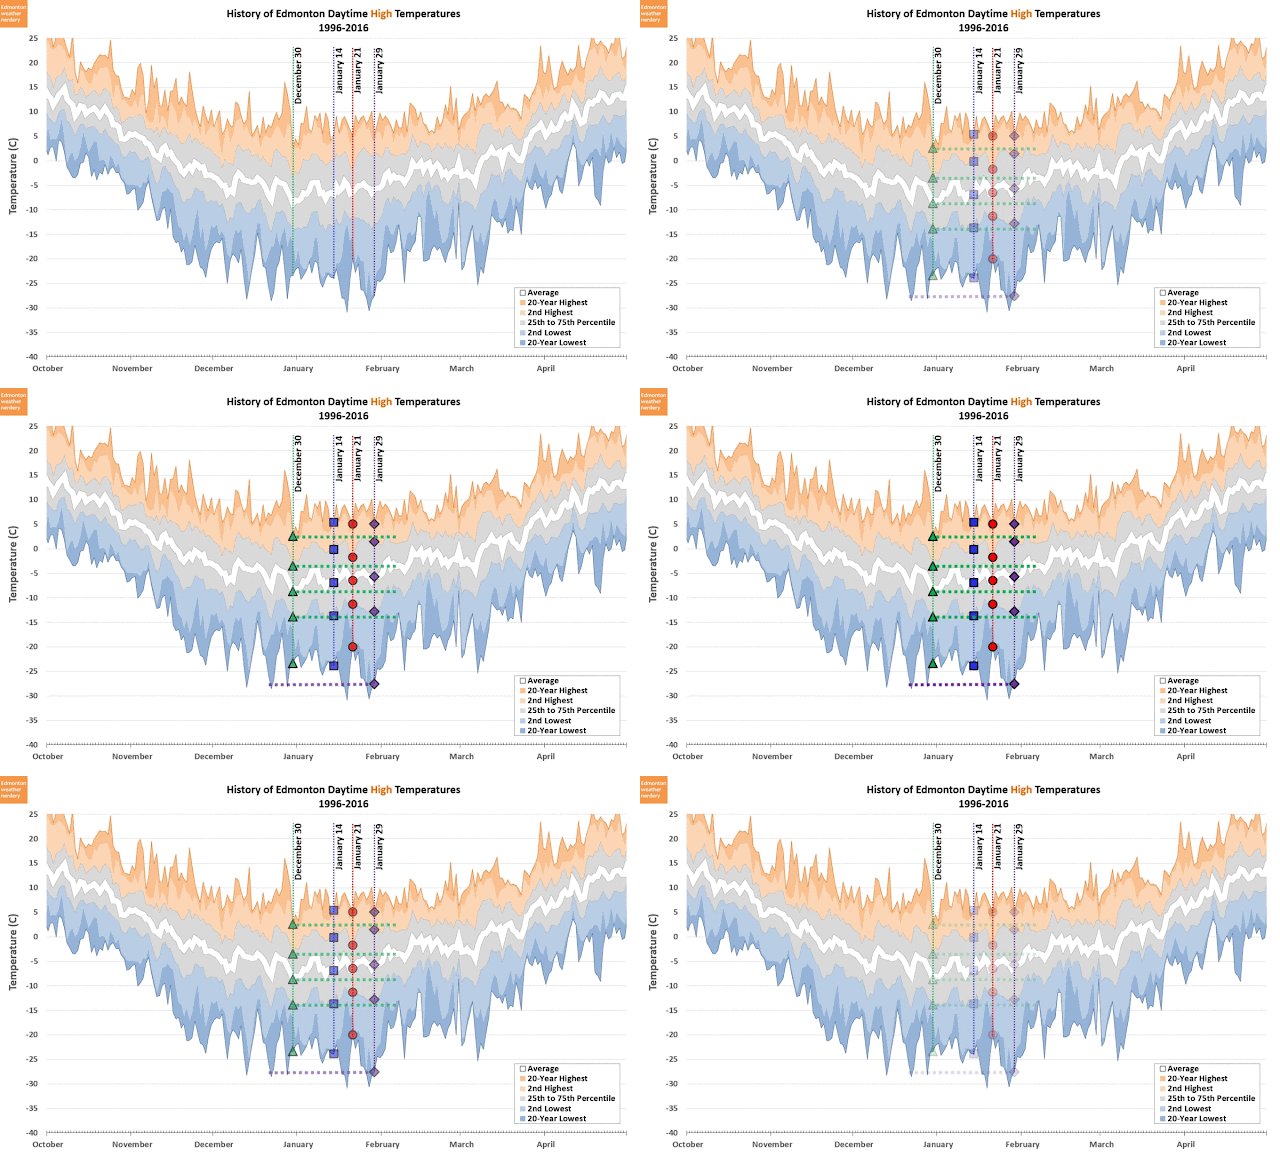
Here I've identified 4 dates that we might want to call the low-point for the year. We have December 30 with a green triangle, January 14 a blue square, January 21 a red dot, and January 29 a purple diamond. I wouldn't actually have picked January 14th, but it's the "official" date, so I figured it should be included.

This chart shows the distributions of the daytime High temperature at Blatchford for the last two decades. It has the average temperature, the 25th & 75th percentiles (the range where temperatures will fall about half of the time), and the warmest & coldest days since 1996. 

For each of those temperatures the green triangles for December 30 are the lowest, except for coldest-since-1996 which goes to January 29. 

So most of the time our daytime High temperatures actually do level-off around New Year's. If we line up all the points on the chart we can see that by mid-to-late January the average and quartiles are several degrees warmer than they were at the end of December. But then occasionally the end of January does surprise us with very cold temperatures (those very cold January temperatures on this chart were mostly during two specific coldsnaps in 1996 and 2004, which we looked at here).

Daytime Lows

The Lows are a little bit less clear-cut. 

The average Low and the 75th-percentile bottom out around December 30th. as we saw with the Highs. The warmest-since-1996 turns around on January 21st. And the 25th-percentile turns around on about January 29th, and that's about where the coldest-since-1996 does too. The "official" date of January 14 is right in the middle of all that, but it's actually a little bit warmer than all the others.

So depending on how you want to define things - between the Highs and Lows, and the averages and percentiles and etc. - we've either just about reached the very deepest part of winter, or we actually passed it a few weeks ago. Or maybe more accurately, winter pretty much stops getting colder around New Year's, but then it doesn't genuinely start warming up again until near the end of January.

If the idea that winter flatlines for an entire month is a bit depressing, Winnipeg and Montreal offer an alternative:


Here we have the average Highs for Winnipeg and Montreal, which both have a more distinct turn-around-point in late-January than Edmonton does. But that means that their temperatures keep dropping for most of the month, instead of settling down at New Year's like in Edmonton (and Calgary too).

Because of that, Winnipeg's early-winter is pretty much the same as Edmonton's, while it's late-winter is much colder. And Montreal's early-winter is warmer than Edmonton's, but it's late-winter is pretty similar.


And we see the same thing with the Lows. Winnipeg and Montreal distinctly turn around in late-January, but at that point the average temperatures are about 5°C colder than they were in December.

It's kind of nice to know that on average, by New Year's day Edmonton's winter has usually thrown its worst at us. And sure, it hangs around down there for a month before things start to warm up again, but that sounds preferable to an extra month of falling temperatures.

2017/01/16

January Unicorns

Did you hear that it's supposed to be warm this week?

In January??

In Edmonton???

But that sort of thing never happens.

...


I've talked about this many times before, but warm January days in Edmonton are actually pretty common. One might even call them reliable, since they happen every year, to one degree or another:


Perhaps more surprising is the fact that warm January temperatures were also pretty reliable over a century ago:


(...although take a look at some of the cold days in that table: -39°C and -40°C as daytime highs5°C one day, and then -40°C a week later...)

Yesterday the temperature made it all the way to 7.1°C, which was a nice surprise:


That made it the 4th warmest January 15 every recorded, but below both 2014 and 2013 which are 1st and 2nd respectively (3rd was 7.2°C in 1965). And 2013 and 2014 also had the 1st and 2nd warmest low temperatures.

If we just look at this week in history, January 16-20th:


Here we have the 50 warmest recorded days for the week of January 16 through 20th (technically 57 warmest, because there's a tie for 50th).

Again we see that both 2013 and 2014 were pretty warm during this week in January, and look pretty similar to what's being forecast for this year. Based on those forecasts we might get a day or two into the top-50, but if we want to break a record the best bet would be today. The 7.2°C record for January 16th was set way back in 1884, and it's pretty low compared to the other days this week.

So enjoy the warm weather, but it's not a unicorn.

2017/01/12

Coldsnaps & Deepfreezes

The weather forecasts for this week had been warning us of a giant deepfreeze, and thankfully that didn't really happen (I like winter, but even I've got limits). It's been cold, but only pretty cold rather than really, really cold.

Last week we looked at Edmonton's epic 26-day coldsnap from January, 1969, and today we're going to take a look at Edmonton's more recent coldsnaps - how often they happen, how long they last, and how cold it gets.

To start off with, here is a chart of daytime high temperatures for the last 6 winters:

Winter Temperatures

I wanted to go back to the winter 2010-2011 with this, because we've seen (back in this blog's very first post) that 2010-2011 was particularly cold compared to other recent winters. We can see that a bit in this chart, with 2010-2011 having a lot of blue for highs below freezing, compared to a warm winter like 2015-2016 which instead has a lot of orange for all of its days above 0°C.

Looking at 2016-2017 so far, we see lots of orange during our November heatwave, but after that we've stayed below freezing more consistently than most of these other winters.

This chart has a lot going on, but today we're really just going to focus on the cold days:

Highs Below -20°C

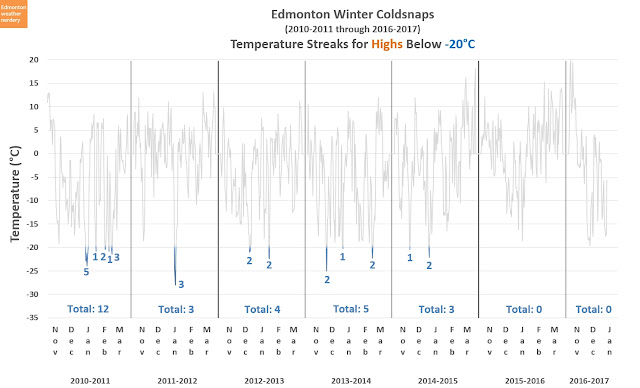
Here's the same chart, but this time the days with High temperatures below -20°C are singled-out. I like this format because it shows how spread out or compressed the different coldsnaps are.

We can really see the difference between a cold winter like 2010-2011 which had 12 highs below -20°C, compared to a mild one like 2015-2016 which had none.

More typically, the winters from 2011-2012 through 2014-2015 all had between 3-5 Highs below -20°C. And there was one 3-day coldsnap in there, but the rest came as 1's or 2's.

For these years the two coldest Highs were January 17 2012 at -28°C, and December 6 2014 at -25°C. And so far in 2016-2017 we haven't had any Highs below -20°C, although we did come close with -19.6°C on December 10th.

Lows Below -20°C

Here we have Lows below -20°C, which is quite a bit more crowded.

I've said in the past (here and here) that right now we average about 23 days below -20°C each winter, and this chart gives us some idea of how that's distributed.

On the very lowend we have 2011-2012 & 2015-2016 with 10 or less, and at the highend are 2010-2011 & 2013-2014 at 40 or more. With two months left in 2016-2017 it looks like we might end up around the 23 day average, but who knows?

If we try to define a typical winter, it looks like most will have the Low drop below -20°C between 3-10 times, and when that happens it will stay there for 2-4 days.

In these last 6-and-a-bit winters the longest streak of Lows below -20°C was 9 days in January 2011, and there were also two 8-day streaks in 2012-2013 and 2013-2014. In 2016-2017 so far we've had a 6-day streak which just ended.

Lows Below -25°C

Moving on to the true deepfreezes, here we have the Lows below -25°C.

Again, 2010-2011 & 2013-2014 are the leaders, well above the other years.

And if we're looking at the "typical" winters we get about 3 of these deepfreezes, and they'll last 1, 2, or 3 days.

For these years the coldest Low was January 18, 2012 at -32.1°C (which I believe would have been my coldest-ever day riding to work). January 17-18 2012 were a two-day streak below -30°C, as were December 6-7 2014.

Right now we've gone 739 days without a -30°C which sounds impressive, but the record is 1,835 days from 1998-2003.

So that was a quick look back at the last 6-and-a-bit winters, because that is what would fit nicely on the graph. Now we're going to take a look at the very longest coldsnaps from the last 20-years. But first a reminder of 1969:

1969

As I said last week, the deepfreeze in January 1969 was epic. With 26 Highs below -21°C and 26 days with lows below -25°C there's nothing else that comes close to it in Edmonton's recorded history.

Recent Streaks with Highs Below -20°C

Here are the longest coldsnaps below -20°C going back 20 years, and they're all pretty short compared to 1969. These are the High temperatures, but I've also included the Lows as dashed lines for reference.

The longest of these coldsnaps was 12 days in January 1998, shown in green. It doesn't really have much competition, because the next-longest are only half as long, with 6 days in January 1996 and 2004.

Those three were all from more than 10 years ago. In just the last 10 years the 5-day coldsnap in 2011 is the big winner.

One thing to mention about this chart is that the colourful background shows the average, maximum, and minimum temperatures recorded going back to 1996. Several of these coldsnaps follow that minimum temperature line pretty closely - the 1998, 2004 and 2011 coldsnaps all set quite a few of the recent records.

Recent Streaks with Lows Below -20°C, since 1996

Now we've switched to Lows, and this is actually going to be a combination of Lows below -20°C and Lows below -25°C, because the two overlap.

In the last 20 years the longest streak of Lows below -20°C was 23 days from January 3 through February 4 1996. That coldsnap also had the record-longest 8 days below -25°C, and another 5-day streak below below -25°C. We also saw this coldsnap in the previous chart, with 6 Highs below -20°C.

The second-place streak was January 1 through 15 1998 with 15 Lows below -20°C, which included two 5-day streaks below -25°C. And we also saw this coldsnap in the previous chart, with 12 Highs below -20°C.

1996 and 1998 are pretty far back, so now lets just look at the last 10 years.

Recent Streaks with Lows Below -20°C, since 2006

This is all we've got for Low temperature streaks for the last 10 years.

2008 had two 9 day streaks below -20°C: one in January and another in December. That January streak also had 6 days below -25°C, and the December one had 5 days below -25°C. Again we can see that these two streaks follow the minimum-temperature line and set several of the recent records.

2011 also had a 9-day streak below -20°C, which we saw in one of the first charts today.

Finally, lets take a look at the coldest-of-the-cold:

Days Below -30°C

In recent years, the most days we've spent below -30°C was 4, in January 1997. And again, this coldsnap set several of the recent records. This isn't much compared to the historic record though, which was 16 days below -30°C, from January 28 through February 12, 1887.

So with all of that said, none of our recent coldsnaps come close to the historic deepfreezes. We have warm winters like 2015-2016 and cold ones like 2010-2011, but in a typical winter we'll get about 3~5 coldsnaps, and they usually don't last longer than about 5 days.

2017/01/08

2016 in Review - Precipitation

Last week we did a yearend review of 2016's temperatures, and today we'll be looking at precipitation. We'll start with total precipitation - rain & snow - and then look at snow in more detail at the end. As is usual with precipitation, Environment Canada's records at Blatchford have some problems, so this will mostly be data from the International Airport, with a bit of Blatchford mixed in.

For fun, here's the 3d chart of every precipitation event at the International Airport from the last two decades:


There's a prominent ridge in May-July where we typically get the bulk of our precipitation for the year, and 2016 was no exception. Beyond that though, this chart looks neat, but it's hard to read any actual information from it. 

Total Precipitation

Here is how the precipitation piled up over the year: January-April were a very flat start to the year. Then a big storm on the May long weekend pushed 2016's total up above the average. It stayed there for the rest of the year, finishing at 496mm and right at the 75th percentile.


496mm of total precipitation is pretty high compared to recent years, putting it just below the 511mm of 2010. 2016 had the 2nd most precipitation since 1998, but 1998 is about the point where Edmonton's average precipitation dropped down a notch.

With the 5-Year average line on this chart, we can see that starting in around 1998~2000 Edmonton's precipitation fell from an average of about 475mm per year down to about 410mm. So 496mm in 2016 is high for recent years, but it would have been pretty typical from the 1960s-1990s.

Monthly Precipitation

Here we have the number of days with precipitation throughout the year, and from May through December things were a little bit above average. January through April were all low though, coming in below the 25th percentile.


In terms of the actual amounts of precipitation that we received though, April, May and October were the big surprises. April had almost no precipitation, which is unusual for the start of spring, while May and October both doubled their averages.

Total Snow

Now lets switch over to snow.

When we'd looked at Edmonton's history of snowfall, I'd said that I think it makes more sense to look at snowfall totals in terms of winters (the winter of 2015-2016, 1968-1969, etc), rather than as calendar years.

But since the calendar year just ended, we might as well look at the total snow for calendar-year 2016. Typically we get between 100-130cm, and in 2016 we got 78.2cm which is a little on the low side.

Monthly Snow

In terms of monthly snow, one strange thing about 2016 is that it's most snowy month was October. 
That was partly because October was very snowy, but also because November, January, March and April were all well below average.

Snow on the Ground

Back in November I'd looked at when we usually get our first lasting snow. In terms of 2016 we can see that the large snow we got in October melted off, and it looks like the first lasting snow showed up in mid-November.

This chart is a bit problematic though, because this data is for the International airport, and in mid-November the airport had a big snowstorm which didn't really hit the city at all.

So here's the same chart, with an extra line added for Blatchford data:


And that's a little bit better, although it still shows "trace" amounts of snow in the last half of November. In reality things were basically snow-free in the city until the first week of December. 

Unfortunately 2016 is the only year that I can correct like this, because Environment Canada's snow data for Blatchford is missing for 2007-2015. So I'll just continue to use data from the International, but I'll try to sanity-check it when possible.

Weekly Precipitation

To end things today, we're going to switch from snow back to total precipitation

Here the total precipitation for the year is broken down by week, and I think this one is interesting just because of how concentrated our precipitation was. About 40% of 2016's precipitation fell during just 3 weeks: one in May, one in July, and one in August. The other 49 weeks of the year were left to make up the other 60%.

2017/01/06

It was the winter of '69

Edmonton's greatest recorded deepfreeze started on January 7th, 1969, and it lasted all the way to February 1st. By the end of it Edmonton Blatchford had recorded 26 straight days where the daytime high temperature did not break -21°C.

Note: this post is quite old, but it has been updated throughout with interactive dashboards.


It was such a big deal that the Edmonton Journal printed this certificate:
Source: Photobucket
The temperatures in that certificate are all in Fahrenheit, and so -6F is equal to -21.1°C, and -39F is 39.4°C.

This dashboard has the High temperatures in Celsius, and it also shows the surrounding years for comparison:


Today we're going to take a closer look at the 1969 coldsnap, but for some context first we're going to start with recent history:


In the background of this chart we have "typical" temperatures for the last 20 years - the average, quartiles, and maximum & minimum temperatures since 1996. There's also a line for the daytime high temperatures from the winter of 2015-2016, with highs that were above freezing in orange, and highs below freezing in blue.

And now lets look at 1969:

The 1969 Coldsnap

Here 1969 is shown as the dashed, grey line, and its historic coldsnap is highlighted in dark blue.

We know that 2015-2016 was a pretty mild, El Niño winter - there wasn't a single high below -20°C. And we can see that for almost the whole winter 1968-1969 was at least 5°C or 10°C colder than last year was. And if we just focus on the coldsnap, those 26 days were all basically as cold or colder than anything we've seen in the last 20 years.

Right before the 1969 coldsnap started the temperature had been very warm at just above 5°C, so they probably had no idea what they were in for. And once it was all over, after almost a month below -20°C the temperature jumped straight up to 0°C, which must have felt amazing.

Here's another look at that winter. The "official" deepfreeze ran from January 7th to February 1st, but things actually got cold on December 23, had a brief warmup on January 4th and 5th, and then dropped into the real deepfreeze.


Was the 1969 coldsnap truly unusual, or has a bit of "walking uphills both ways" crept into this story?

Other -20°C Coldsnaps

Here are the next-longest coldsnaps below -20°C, and none of them come close to January 1969. The 1969 coldsnap lasted 26 days, and going all the way back to the 1880s its closest competitors were 16  days in December 1933; 16 days in January 1954; and 17 days in February 1936.

This dashboard shows all of the 15+ day coldsnaps with below -20°C, to see how January 1969 compared:


Other 25-day Coldsnaps

If instead we go looking for other 25-day-streaks, we have to warm things all the way up to -16°C. And when we do that, December 1933 and February 1936 show up again.

For a 26-day streak we have to raise the High to -15°C, and then it's just 1936 and 1969:


So January 1969 really was pretty unique in Edmonton's history.

It's worth mentioning that this deepfreeze wasn't limited to Edmonton:

Calgary

Here we have Calgary's high temperatures during Edmonton's coldsnap.

Calgary had a deepfreeze too, but it started one day later, ended two days earlier, and in the middle it popped up to -16°C for one day. It's not quite as headline-ready as "26 days below -6F!" but Calgary still had 22-of-23 days below -4F.


Low Temperatures

Today we've just looked at daytime highs, but to finish things off I've added the daytime lows for the January 1969 deepfreeze.

That stretch also included 26 straight low temperatures below -25°C, which was another record - the next closest was 19 days below -25°C in 1934. And during the 1969 coldsnap there were 18 lows below -30°C, and 7 lows below -35°C.

Here are the Lows in dashboard form:


The 2nd longest streaks of -25°C Lows were 1933 & 1936 again, with 17 and 18 days respectively.


For a bit more trivia, here are a few of Edmonton's other low temperature streaks:
  • lows below -30°C: 16 days from January 28 through February 12, 1887
  • lows below -35°C: 11 straight days in that same stretch of January 28 through February 7, 1887
  • lows below -40°C: 7 days, from January 28 through February 3, 1893

January 1969 Overall


Believe it or not, January 1969's average High of -22.3°C was only Edmonton's 2nd coldest recorded January, after January 1950's average High of -23°C.

This table has January 1950's Highs on the left side, and 1969's on the right:


January 1969's average Low of -29.8°C (average Low of -29.8°C!) was only Edmonton's 4th coldest, after 1950 again at -32°C, 1886 at -31°C, and 1907 at -31°C:


And here are the Lows for January 1950 on the left, and 1969 on the right:


Update:

Here is one more look at the winter of 1969, showing the Highs & Lows for December through March.

The historic deepfreeze in January was 26 days, but the Lows actually dropped below -20°C quite a bit earlier. From December 22 to February 2 41-of-43 Low temperatures were below -20°C, with only a two day warmup to -10°C and -15°C on January 4th and 5th.

And for some context, here are the deepfreezes from the last few years:

Since 2010-2011 the most Highs below -20°C that we've in an entire winter was 12 days, and the longest stretch was 5 days in a row. Most of our Highs below -20°C have only lasted 1-3 days.

For Lows below -25°C the most that we had in these winters was 17 days, and the longest stretch was 5 days.