2026/08/31

August 2026 Review

So it's the end of August, and we finished off the summer with a pretty quiet month. Let's take our big look back at Edmonton weather for the past month.

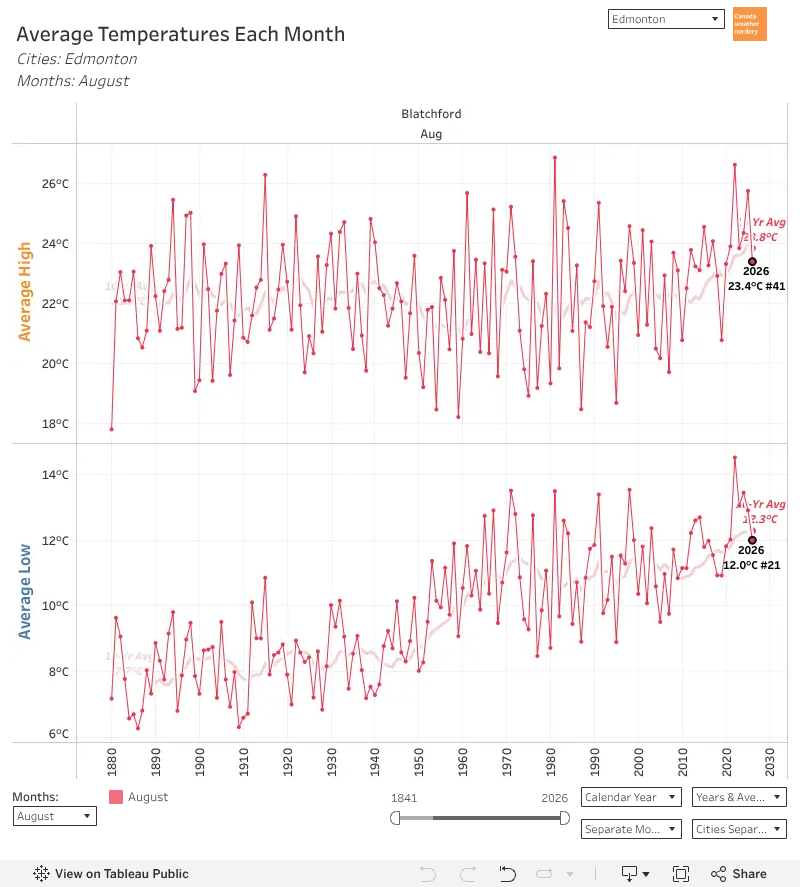
August 2026 was our coldest August since 2020, but historically that still puts it well above average. 

The average High of 23.4°C was the 41st warmest. The average Low of 12°C was 21st warmest. 

(compared to 100 years ago August's average Lows have increased by 5°C)


High Temperatures
August's Highs were a little below average early in the month, and a little above late in the month. 

The coldest High was 17.7°C on the 13th, and the warmest was 29.7°C on the 26th & 27th. Overall 16 Highs were above-average, and 15 were below.

August gets to 30°C about half of the time. 2026 got close with three 29°C days, but didn't quite make it. 

August averages 10 25°C days, and 2026 only got 7. And it averages 23 20°C days, and got 27.


Warm Days So Far
The summer of 2026 was not a scorcher.

At the end of August we've had 89 Highs reach 20°C. 32 of those got to 25°C, and 4 reached 30°C. 

Those numbers are all pretty normal for us They're down from the string of exceptionally hot summers that we had from 2021-2025.

Our 30°C season can stretch into the first week of September, with the occasional stragglers later in the month.

And our 25°C season can extend through September, with a bit of spillover into October.


Low Temperatures
For the Lows 12 were below average, mostly early in the month, and then the other 19 were above average. That included a new record for August 22nd of 16.1°C.

August Lows usually don't have much of a spread.

It averages 19 Lows between 10-15°C, and this year we got 20. 

On the warm side we had 4 above 15°C, and the cool side had 7 below 10°C. Both of those were pretty average.


Warm & Cold Months
August gets orange/warms dots smaller than anything since 2020. The average High of 23.4°C was 1.3°C warmer than the 20th century average. The average Low of 12°C was 2.4°C warmer than the 20th century average.


Across Canada
August was a little above-average across all of Canada.

Kelowna was at the top with an average High of 29.9°C, which was 3.2°C above their 20th century average. At the other end Saskatoon's 24.2°C was -0.2°C below theirs.


Summer 2026
Across the county the summer of 2026 (May-August) was top 20~30 for a lot of the country, including Edmonton.

At the top Kelowna's had its 3rd warmest, and Moncton's was 8th. At the other end Winnipeg, Ottawa & St. John's were around their top-50.


Precipitation
And now: Precipitation.

After a frankly ridiculous June & July, August was mostly back to normal. August averages 50mm.

In 2026 Blatchford got 42.7mm, the airport got 53.6mm, and Stony Plain got 63.8mm.


2026 So Far
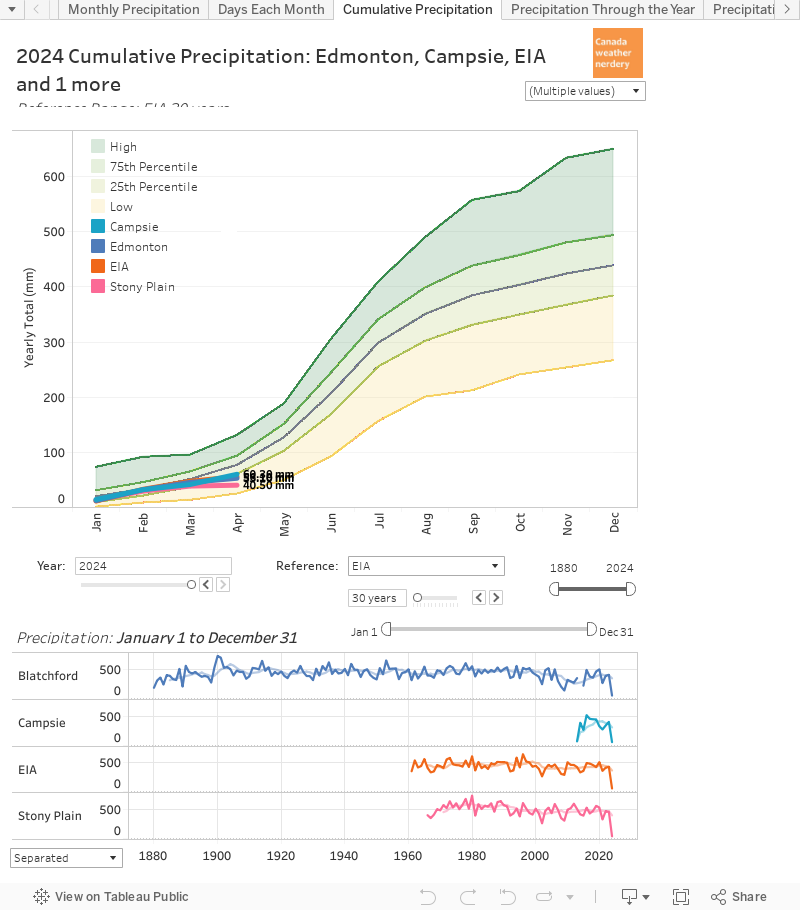
At the end of August Blatchford has had a total of 702.4mm. By this point of the year our average is half of that at around 350mm. 

Stony Plain & the airport are well below Blatchford, but still well above average with 549.3mm & 475mm.

702.4mm is Blatchford's 2nd rainiest year on record, passing 1901's 699m, but behind 1900's 724.8mm. 

Between now and the end of the year we average another 85mm, so catching the record should be pretty likely.

Edmonton's monsoon season typically lasts from mid-May to mid-August. This year things got a little excessive in the middle of that. But by this point we should be pretty much done with our summer storms.


Precipitation Across Canada
Across the country Blatchford's 702mm is enough to put us in the middle of a bunch of cities like Toronto, Ottawa, Montréal and Charlottetown. That's a weird spot for Edmonton to be. At the top Halifax is around 900mm, while Kelowna is below 100mm.

For big August storms Ottawa, Winnipeg & Montréal each got a 30mm+ day. And there were lots more from 20-30mm. Edmonton's biggest was 20.5mm on August 2nd.


The River
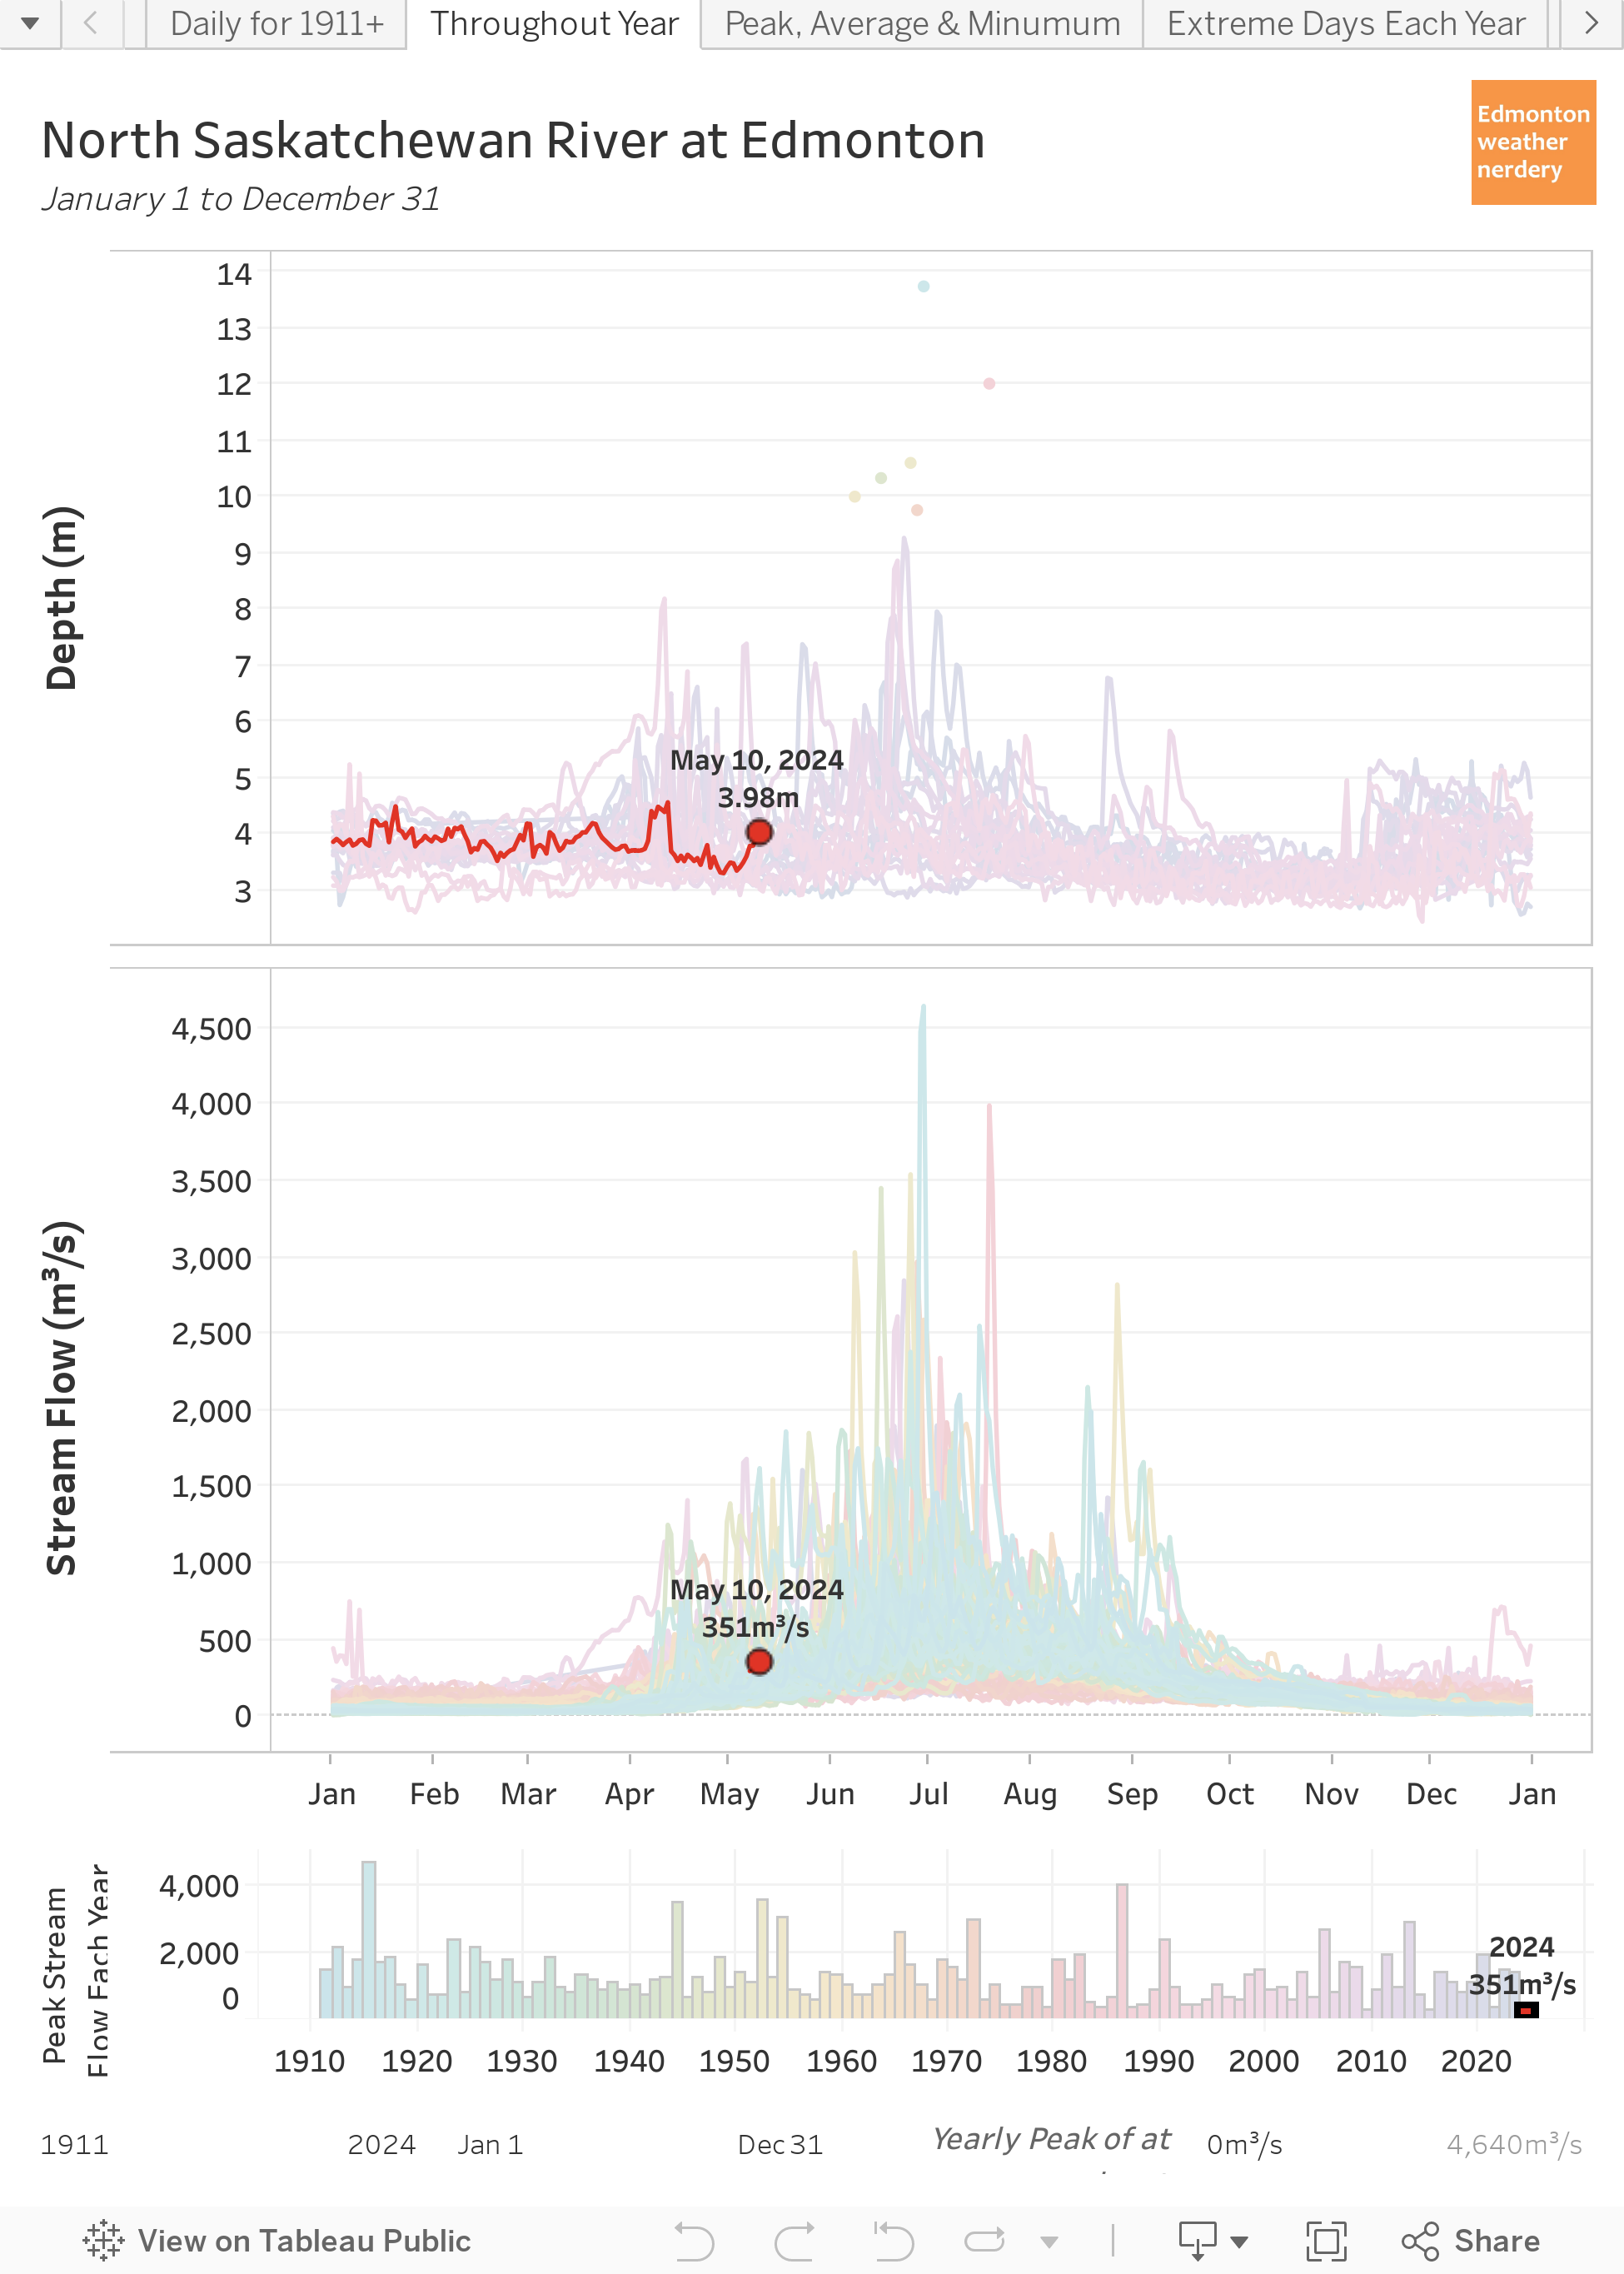
After spending most of July above 500m3/s, in August the river settled down to the more typical range of 200-300m3/s,


September
For September we average 11 days at 20°C, including 3 at 25°C. Although 2025, 2024 & 2022 all started with heatwaves.

September frost and snow can both happen. But our last September frost was 2019, and last snow was 2018.

2026/08/01

July 2026 Review

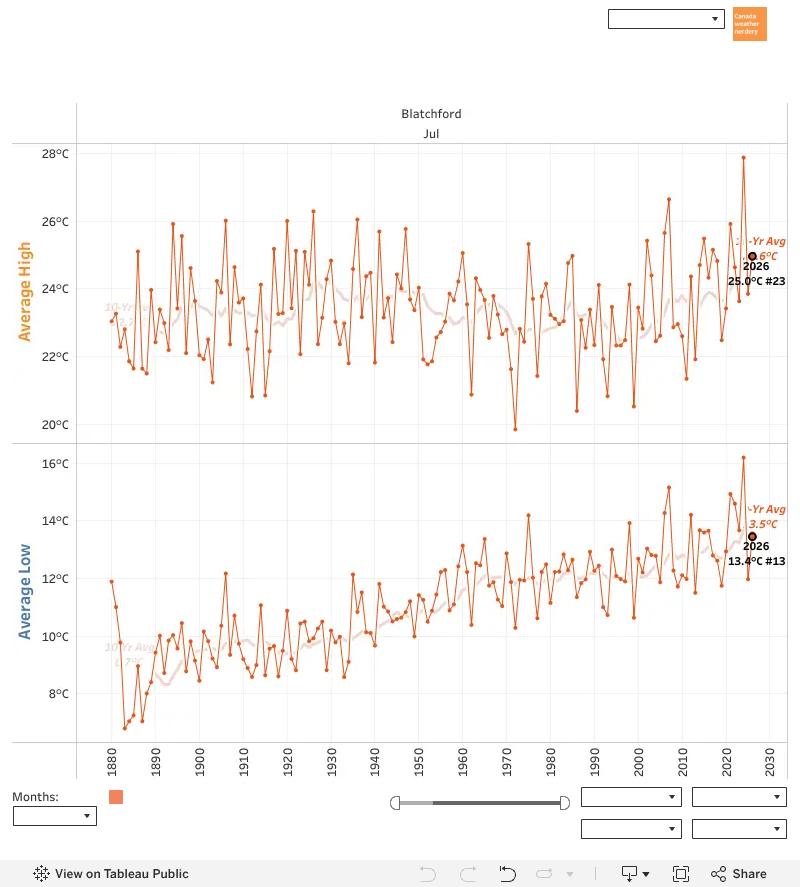
"Unprecedented" gets thrown around a lot, but let's talk about our latest unprecedented summer as we take a big look back at July 2026 Weather for Edmonton.

July 2026 was very rainy, but still managed to be pretty warm. 

The average High of 25°C was the 23rd warmest. That's below #1st place 2024, but above 2025, 2023 & 2022. 

The average Low of 13.4°C was 13th warmest. That's above 2025 but below 2021-2024.


High Temperatures
July's Highs were mostly right around our average of 24°C, with a few warm stretches later in the month. 

Overall 18 Highs were above-average, and 13 were below. And nothing was very extreme. The warmest was 30.7°C on the 17th, and the coldest was 20.4°C on the 5th.

On average July has 13 Highs reach 25°C, and 2026 had 14. 

July averages 2 30°C Highs, and 2026 had 2 on the 17th & 18th. 

July also averages 5 Highs below 20°C, and 2026 had 0 of those cooler days. That's only happened 3 times before, in 1936,1920 & 1881.


June & July
Comparing June & July, they were both ridiculously rainy. But July ended up being pretty warm, while June was fairly cool.


Warm Days So Far
At the end of July we've had 4 Highs get to 30°C. That doesn't compare with 2024 (11) or 2021 (13), but it's more than a lot of years. 

And we've had 25 Highs get to 25°C, which is pretty typical. Some big years were 2023 (41), 2021 (36) & 2018 (42).


Low Temperatures
For Low temperatures July 2026 had 21 above-average and 10 below. 

They ranged from 8.1°C on the 6th to 17.8°C on the 17th. A few of those could have been higher, but got knocked down by evening storms.

July Lows usually don't have much of a spread. 

We average 3 below 10°C, and 2026 had 2. 

And we average 7 above 15°C, and 2026 had 7.


Warm & Cold Months
July gets orange/warms dots. It's not as warm as 2024, but was warmer than a lot of years. 

The average High of 25°C was 1.7°C warmer than the 20th century average.

The average Low of 13.4°C was 2.4°C warmer than the 20th century average.


Across Canada
July was above-average across most of Canada, with just the west coast and Dawson City on the cool side. 

Kelowna was at the top with an average High of 31.7°C that was 4.1°C above their 20th century average. 

At the other end Dawson City's 21.3°C was -1.3°C below theirs.


Precipitation
And now the unprecedented part: Precipitation!

July is usually our rainiest month, averaging 90mm.

In 2026 Blatchford almost tripled that, with 267.4mm.

 Meanwhile, the neighbouring stations were way below, with Stony Plain at 110.9mm, and the airport at 107.2mm.

Why the huge difference between stations? 

In June things were close, but in July multiple storms hit Blatchford straight-on, and glanced off the outlying stations. 

Blatchford had 7 20mm+ days. Villeneuve & Elk Island had 2, and the aiport & Stony Plain only had 1.

The stations are usually close over a whole year, although sometimes there are gaps. 

In 2017 the airport was 115mm above Blatchford. 

In 1980 Stony Plain was 179mm above Blatchford. 

For 2026 Blatchford is 174mm over Stony Plain, and 238mm over the airport.

So July's 267.4mm ends up as Blatchford's 3rd rainiest month on record. 

The only months with more were:
  • last month's 269.1mm (1.7mm more)
  • July 1901's 282.7mm (15.3mm more)

July 1901's monthly record remains unbroken. But June+July 2026 dropped 536.5mm, which is...unprecedented. 

The previous record was 1901's 359mm (178mm less). And the average is 160mm, so 2026 was 3.3x that.

We've only ever had 3 months get to 250mm: July 1901, and June & July 2026. 

And only 4 more have reached 200mm: July 2012 (Stony Plain), July 1982 (airport), July 1937 & June 1914.

So it's a lot of rain, and we got two of them in a row.


2026 So Far
At the end of July we've had a total of 659.7mm. That is the 3rd highest year on record, with 5 months to go.

The only years with more were 1901's 699mm, and 1900's 724mm. 

In August we average another 50mm, which would move us very close to the record.


Storms
This year Blatchford has had 12 days with 20mm or more. The previous record was 7. 

8 of those got to 30mm, when the previous record was 6 (and 3 is a lot). 

And 4 of those got to 40mm, when the previous record was 2. 

So the flooding is not a surprise.

Our monsoon season usually stretches from mid-May to mid-August, so we've still got a few weeks left.

June & July both average around 15 days with rain. In 2026 Blatchford got 19 & 17 respectively. Things start to taper off in August, with it averaging 12 days.


Precipitation Across Canada
Blatchford's 659.7mm is enough to take 4th place among these Canadian cities. That last time that happened was never.

Charlottetown is a bit ahead with 673mm, while Halifax & St. John's are near 800mm.

Calgary is down at 241mm, after getting only 17mm in July.

For big July storms it's Edmonton, and then everyone else. 

We got 5 30mm+ days, while Ottawa got 2, and a few other cities had 1. Edmonton's 268mm was 105mm more than 2nd place Ottawa's 163mm. 

And for June+July Edmonton's 537mm was 250mm more than Ottawa's 287mm.

So who else gets 250mm+ months? 

They're fairly common in Vancouver & St. John's. Victoria, Halifax and Moncton have gotten quite a few as well. And Winnipeg got one in 1901 (like Edmonton), while Ottawa & Montreal got one in 1899.

One notable difference with Vancouver's 250mm months is that they're all in the winter - usually November through January.

But even in Vancouver it's unusual to get 2 in-a-row. The last time that happened was November & December 1988.

350mm+ months are pretty rare:
  • Halifax (3, most recently August 1971)
  • St. John's (December 1909)
  • Vancouver (8, most recently November 2006)
  • Victoria (November 1990)
Vancouver's 525mm in January 1935 is the big winner.


The River
Even with all of July's rain, the river is now back around 320m3/s, which is pretty typical. 

It started July at 1,300m3/s, which is a lot, but not as high as 2020's 1900m3/s. And then it spent a few weeks in the 500-600m3/s range.


August
For August on average we have 25 Highs which reach 20°C, including ~10 above 25°C. 

About half of the time August hits 30°C. 

Most Lows are 10~15°C, but half of the time August will have a night below 5°C. 

And August is our 3rd rainiest month averaging 52mm.

2026/07/01

June 2026 Review

And so we've reached the end of a fairly historic June. Let's take a big look back at Edmonton weather.

It's perhaps unsurprising given all the rain, but June 2026 was quite cool.

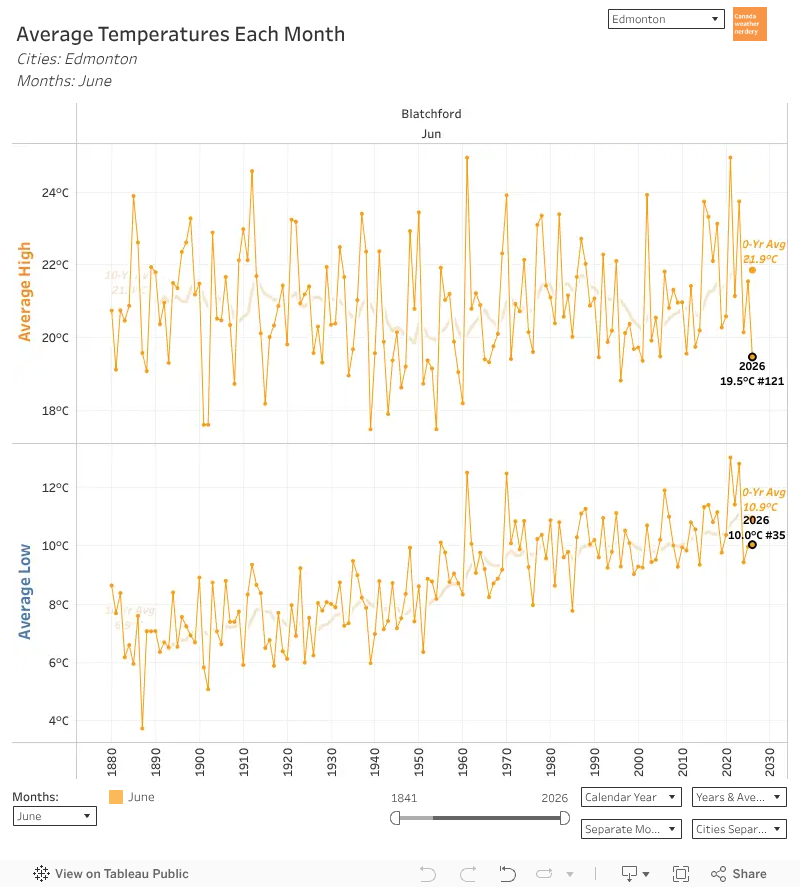
The average High of 19.5°C was the 122nd warmest out of 147. That's around the same as 2013 & 2011.

On the other hand, the average Low of 10°C was actually 35th warmest.


High Temperatures
June's Highs ranged from 10°C on the 1st to 25.9°C on the 14th. 12 Highs were above average. and 18 were below average. The 1st & 2nd were the coldest in 30+ years.

June averages 18 Highs above 20°C, and 2026 only had 15. 

And on average 5 of those get to 25°C, and 2026 got 5. 

It's a little weird that the Highs made this a bottom-25 year, because it was honestly pretty unremarkable.


Low Temperatures
For Low temperatures June 2026 had 10 above the 30-year average (which is still much higher than the long-term average), and 20 below. They ranged from 6.6°C on the 23rd to 15.1°C on the 25th.

June Lows usually don't have much of a spread. We average 2 above 15°C, and 2026 had 3 (2023 had 12). And about half of the time we will get a Low below 5°C, but 2026 had none (2024 had 4).


Warm & Cold Months
June's Highs get a blue dot. The average of 19.5°C was -1.3°C cooler than the 20th century average, and close to 2013 & 2011. 

The Lows are a pretty typical orange. 10°C is 1.4°C warmer than the 20th century average.


The Horserace
Halfway through 2026 and our average temperature is the 29th warmest on record, and 0.92°C above the 20th century average.

Almost all of that was due to our January & February heatwaves. Since then we've mostly been pretty average.


Across Canada
Across the country June was a little cool on the prairies, and a little warm everywhere else.

The Highs ranged from 2°C above the 20th century average in Victoria, to -1.3°C below in Edmonton & Calgary.

For the year so far Kelowna Highs have been its 3rd warmest, Victoria is 9th, and Vancouver is 14th.

For everyone else the first half of 2026 has ranged from top-25 to top-70.


Precipitation
And now...precipitation!

June is usually our 2nd rainiest month, averaging 78mm. But wow, June 2026 really showed off. 

Blatchford ended up with 269.1mm, Stony Plain got 256.3mm, and the airport got 222.5mm.

Our record for June had been 216.5mm, from 1914. But 2026 blew that away. 

And our rainiest month ever recorded was 282.5mm, in July 1901. In the end 2026 missed that record by just 13.6mm. But it sits comfortably as our 2nd rainiest month on record.

June and July average around 15 days with rain. June 2026 got 20 rainy days at Stony Plain, 19 at Blatchford, and 18 at the airport.

By the end of June we average around 208mm of precipitation for the year. 

The rainy June pushed Blatchford to 392mm, Stony Plain to 375mm, and the airport to 314mm.

In a full year we get around 430mm of precipitation, and June 2026 just delivered 2/3 of that.

This is our peak storm season, and we got several 30mm+ days. The largest were June 21st with 73.3mm at Stony Plain and 63.8mm at Blatchford. The airport had an underachieving 45.9mm.

Blatchford's 63.8mm was its 11th rainiest day on record.

For Stony Plain's 73.3mm day, it had only ever had 7 days that big, the airport has had 1 (in 1990), and Blatchford has had 5 (most recently in 1990).

Blatchford got 105.7mm over the 3 days from June 20-22. That's only the 6th time that has happened at Blatchford.

And Stony Plain's 2-day total for June 20-21 was 123.2mm. That's only happened twice before, in 1953 & 1937 at Blatchford.

Edmonton's 380mm of total precipitation might feel impressive, but at the end of June Halifax & St. John's are both over 700mm. And while we had a record-breaking June, in Calgary their 104mm was just a bit above average.

For big storms it's not often that we see Edmonton leading the pack, but here we are.

Our 63.8mm was ahead of Regina's 57.5mm. And our monthly total was more than 100mm ahead of anyone else.


The River
With all the rain the river saw 2 nice little bumps up to around 6.5m & 1,300m3/s. 

That's a fairly typical summer peak, similar to 2024 & 2023. 2020 got to 8m & 1,900m3/s, and 2013 (Calgary's flood year) got to 9.2m & 2,850m3/s.


July
For July, the average High is about 23.5°C. Around 25 days reach 20°C, including about 10 at 25°C. Most Julys will get at least one 30°C day, but recently 2020, 2019 and 2016 didn't. July is also usually (usually) our rainiest month, with an average of 90mm.