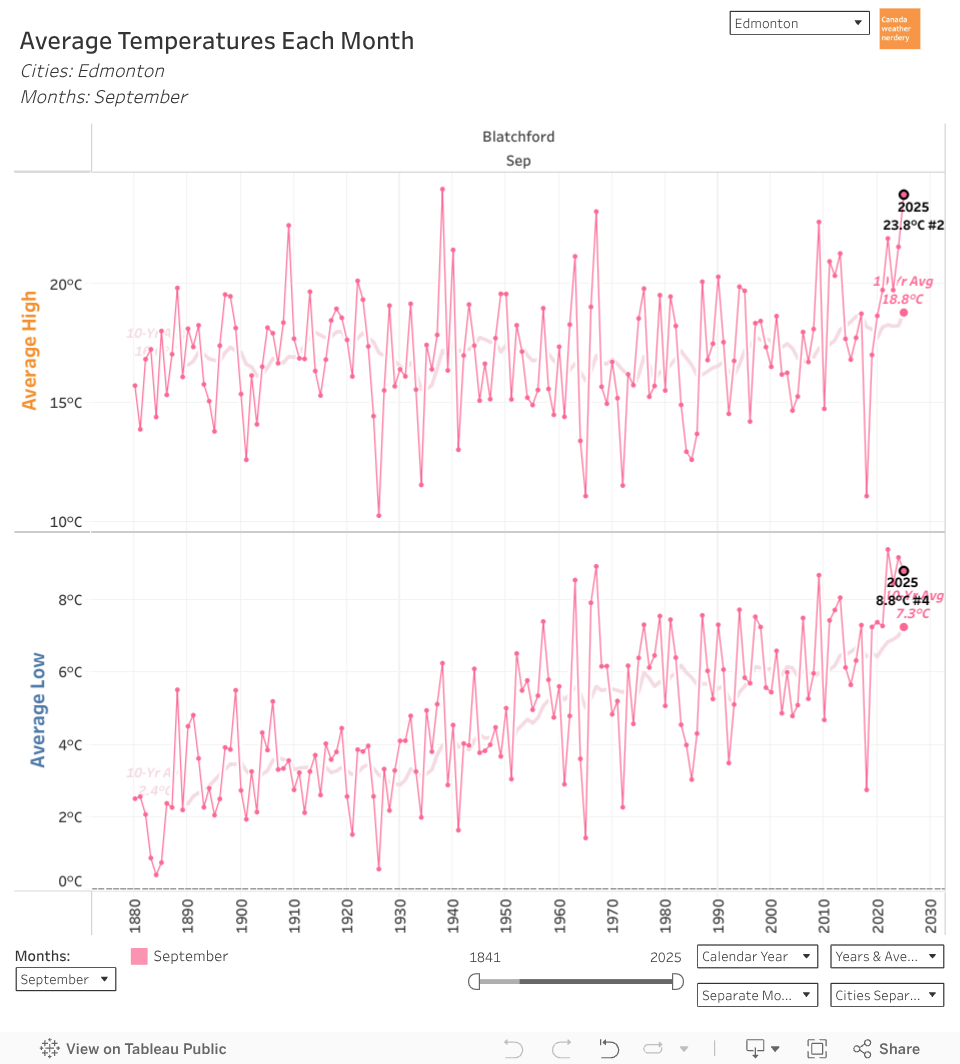
The average Low of 8.8°C was the 4th warmest. For recent years that joins 2024's 2nd warmest 9.2°C, and 2022's record of 9.4°C.
 Even though September 2025's Highs and Lows weren't #1 individually, combined they made this the warmest September on record.
For 2025 that joins our 5th warmest August, and 6th warmest May.
Even though September 2025's Highs and Lows weren't #1 individually, combined they made this the warmest September on record.
For 2025 that joins our 5th warmest August, and 6th warmest May.
In recent years we've had:
In recent years we've had:
- #1 May in 2023, #6 in 2025
- #1 June in 2021, #3 in 2023
- #1 July in 2024, #3 in 2023, #6 in 2022
- #1 August in 2022, #5 in 2025
- #1 September in 2025, #3 in 2022, #5 in 2024
- #1 October in 2022
- #1 December in 2023
High Temperatures
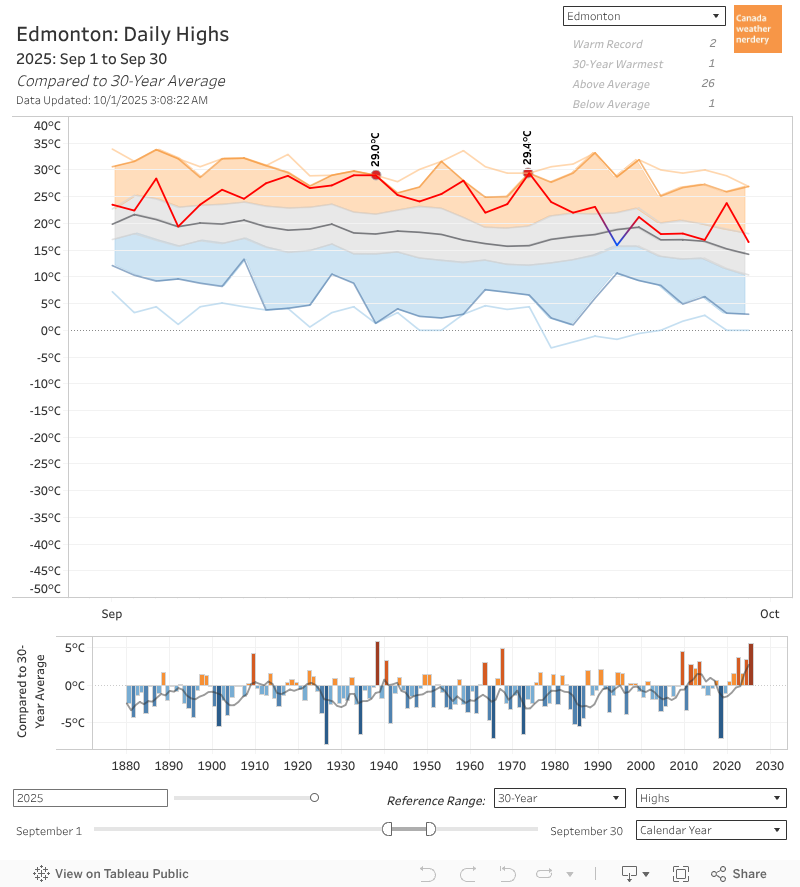
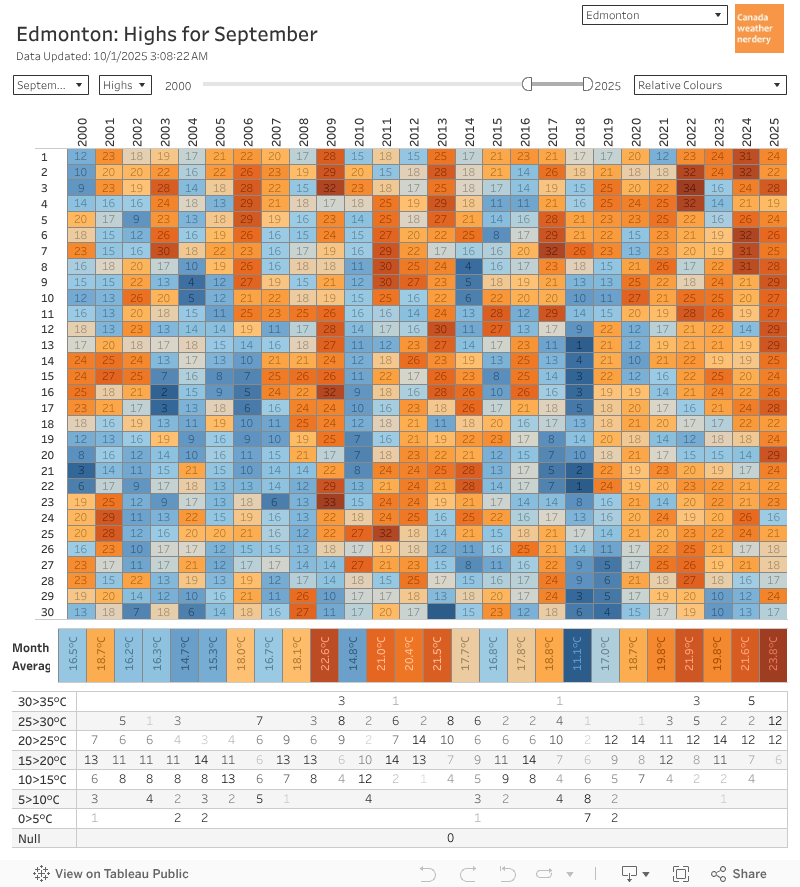
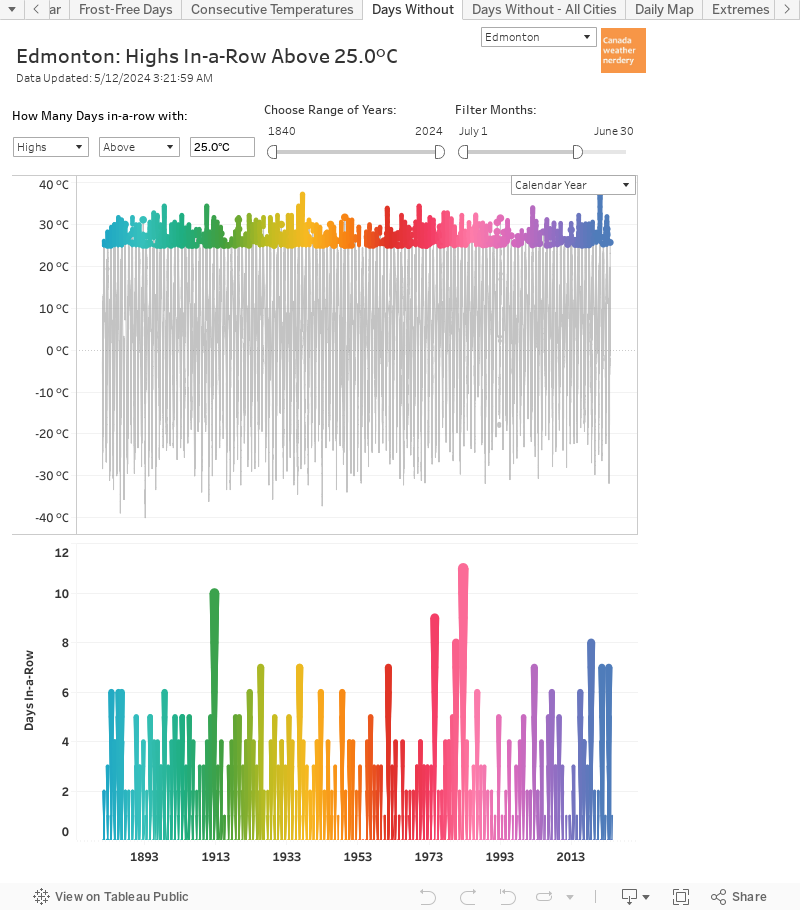
That included 12 25°C Highs, when the average is around 3.
There were no 30°C days, but it did have 3 29°C Highs on the 12th, 13th & 20th.
The coldest High was 15.9°C. September averages 8 Highs below 15°C.
Hot Days So Far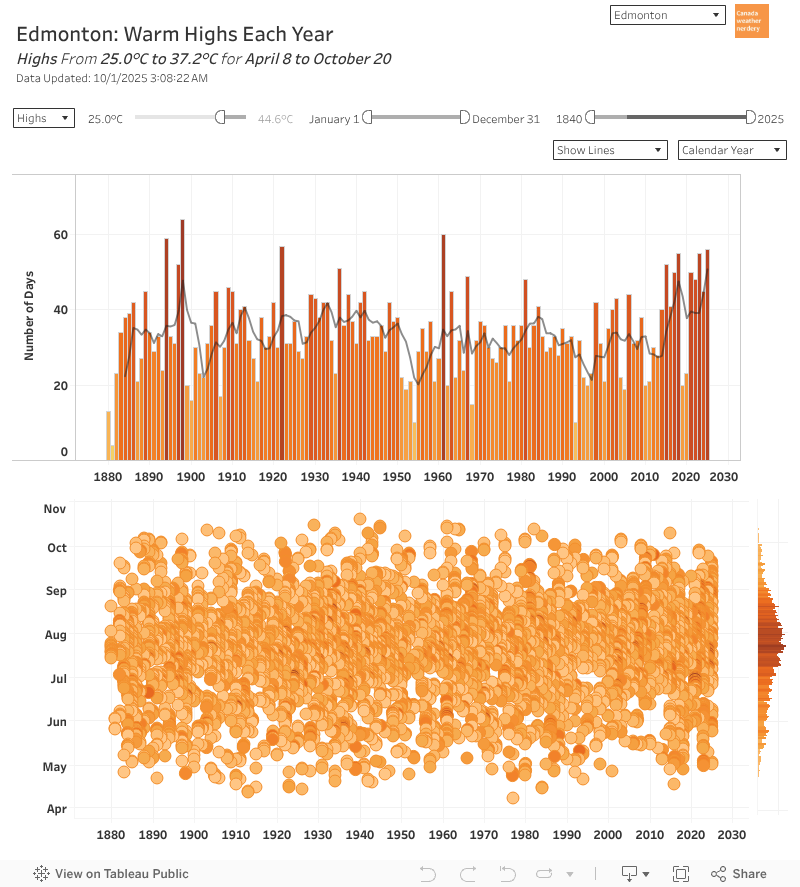 We're getting to the end of our hot days, and 2025 will likely end up with 14 30°C Highs, which ties 1961 for the 3rd most on record (behind only 2024 & 2021).
Hot Days So Far
And 2025's 56 25°C Highs is the 5th most on record, and the most since 1961 (1898's record is 64).
Low Temperatures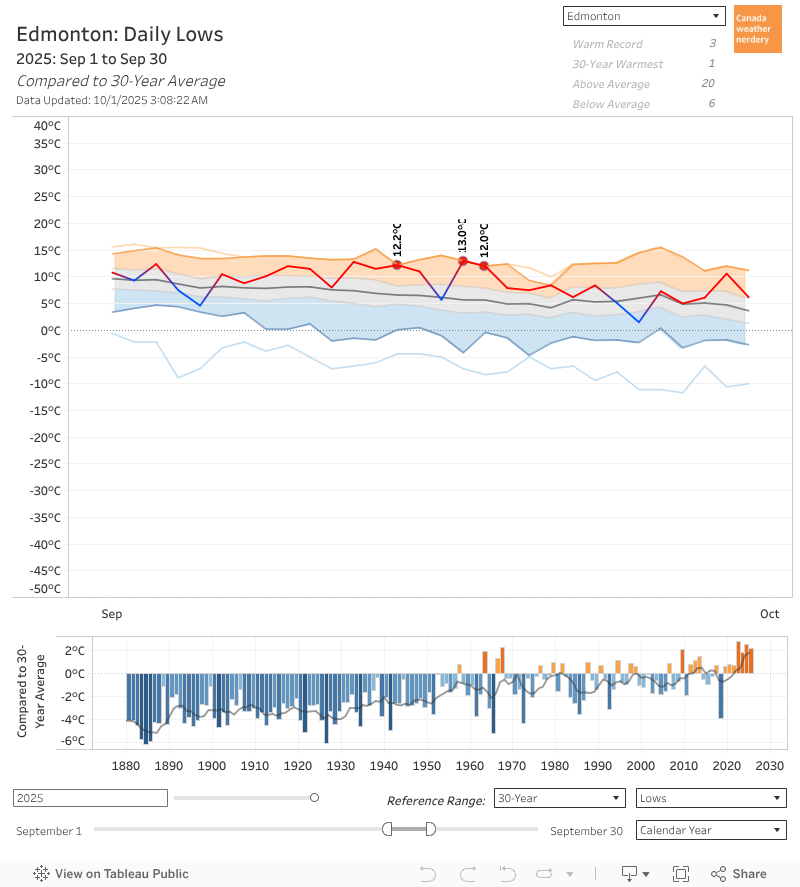 September's Lows were also mostly well above average, but did include 6 below-average days.
But there were also 3 new daily records on the 14th, 17th & 18th.
September's Lows were also mostly well above average, but did include 6 below-average days.
But there were also 3 new daily records on the 14th, 17th & 18th.
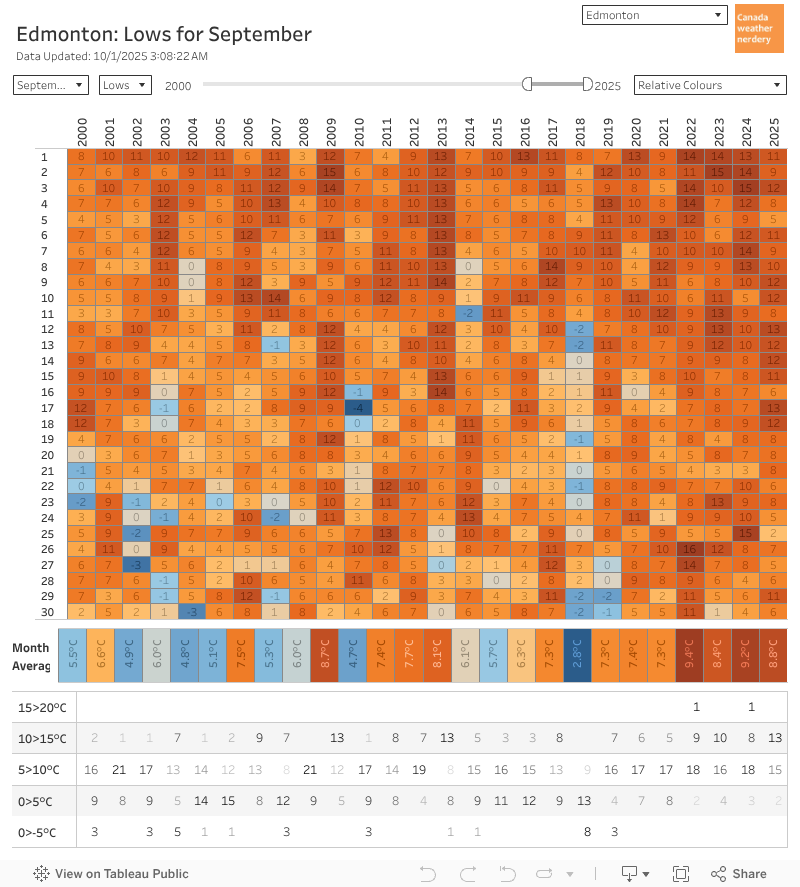 September averages 6 Lows above 10°C, and 2025 had 13.
Low Temperatures
It also averages 1 below-freezing Low, but 2025 was frost-free.
The last time that we had a September frost was back in 2019.
2025 Records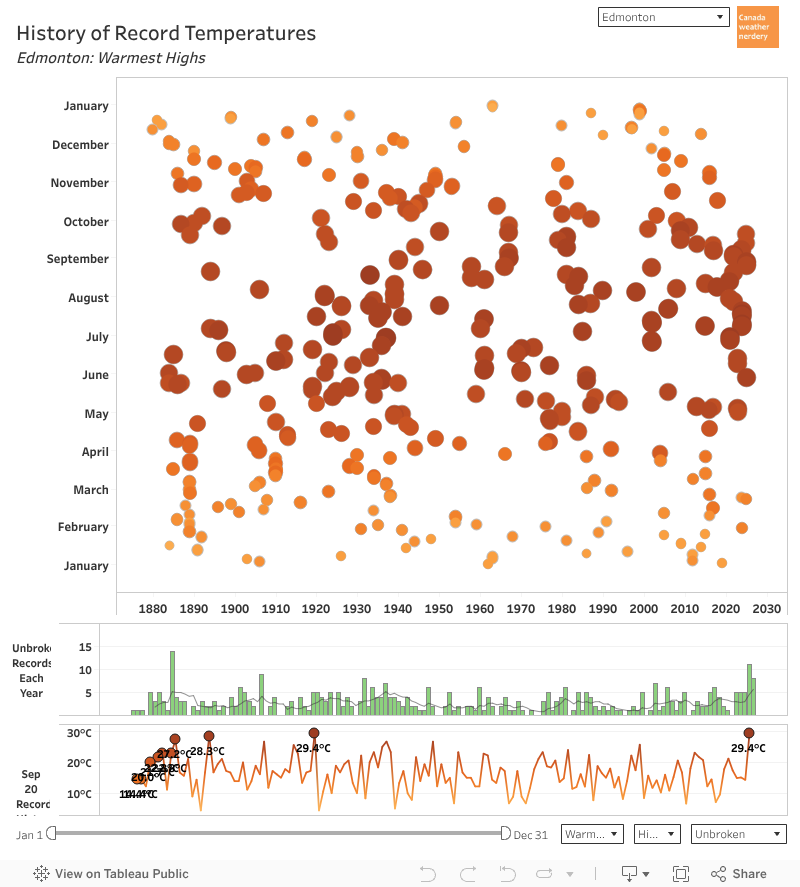 So far 2025 has set 8 new daily record Highs. That's below 2024's 11, but above the 5 from 2021-2023.
2025 Records
And 2025 has 6 record warmest-Lows. That's more than a lot of years, but 2021-2024 all ranged from 10-15.
Early Frost History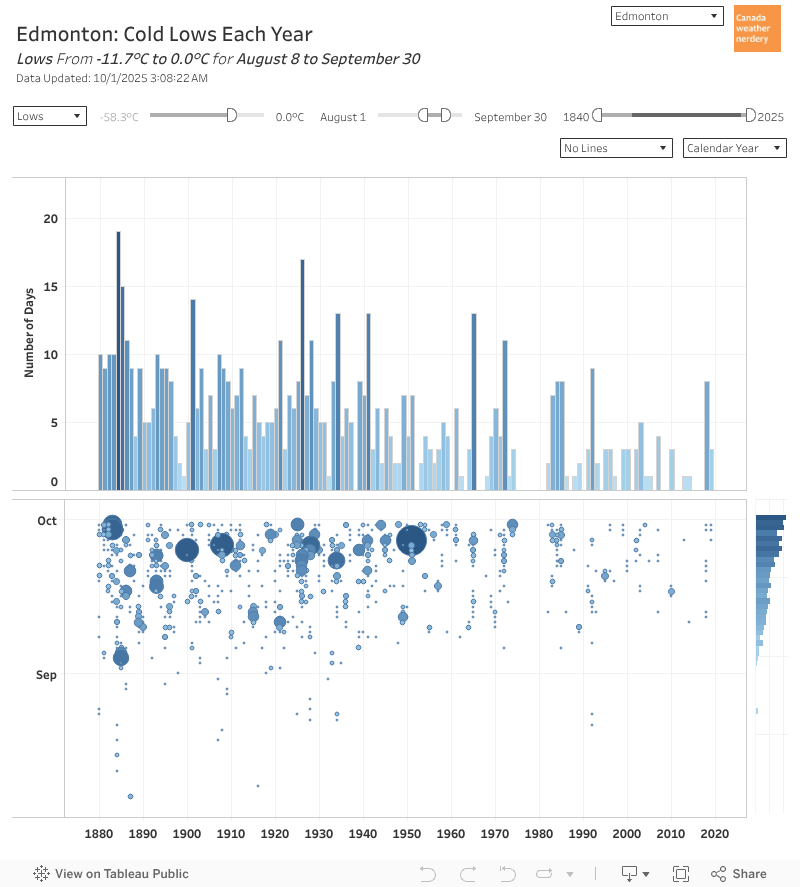 This shows Blatchford's history of early frosts, counting the 0°C Lows which occurred each year before October.
Early Frost History
Right now we've gone 6 years without a September frost. The longest gap on record was 7 years from 1975-1981.
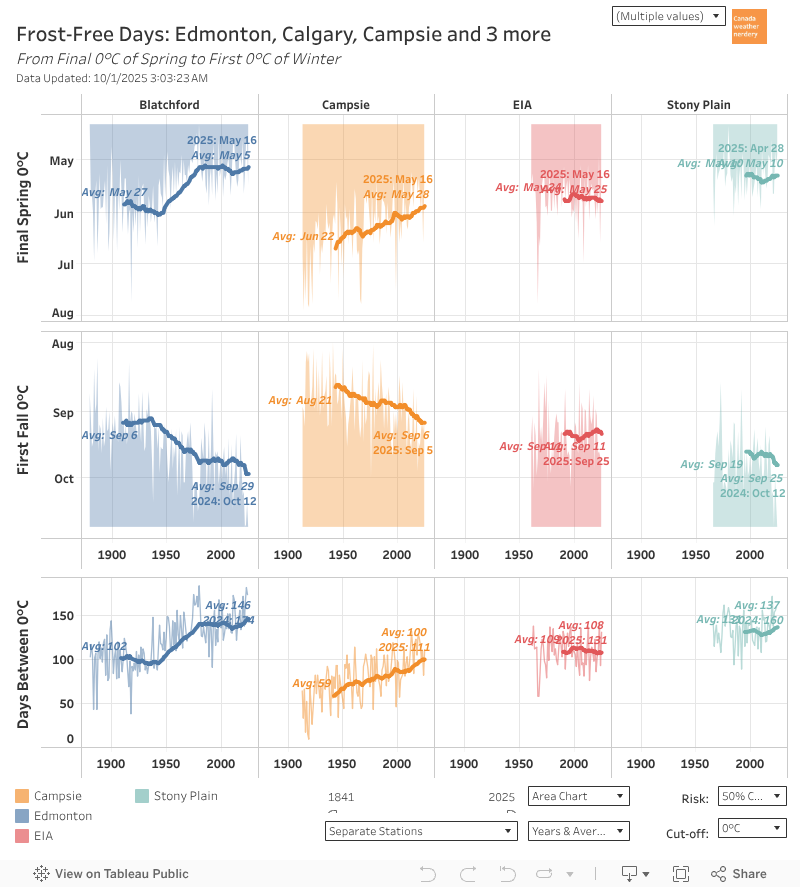 Around town, the airport did get its first frost on September 25th, which is about 2 weeks later than its average.
And Campsie's September 5th frost was right on its average.
Around town, the airport did get its first frost on September 25th, which is about 2 weeks later than its average.
And Campsie's September 5th frost was right on its average.
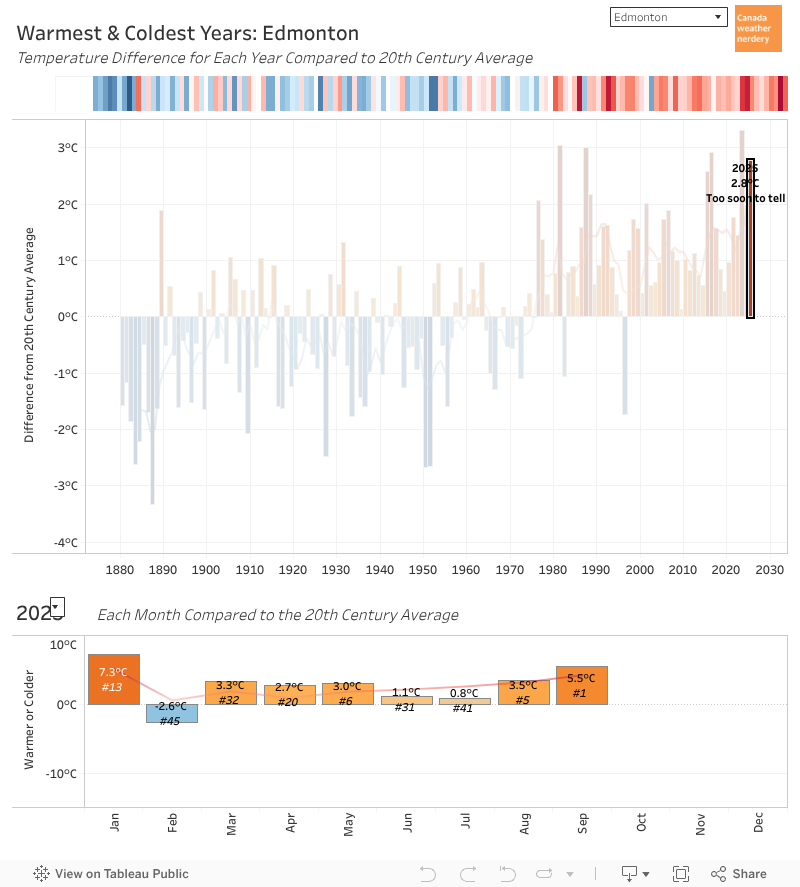
The Horserace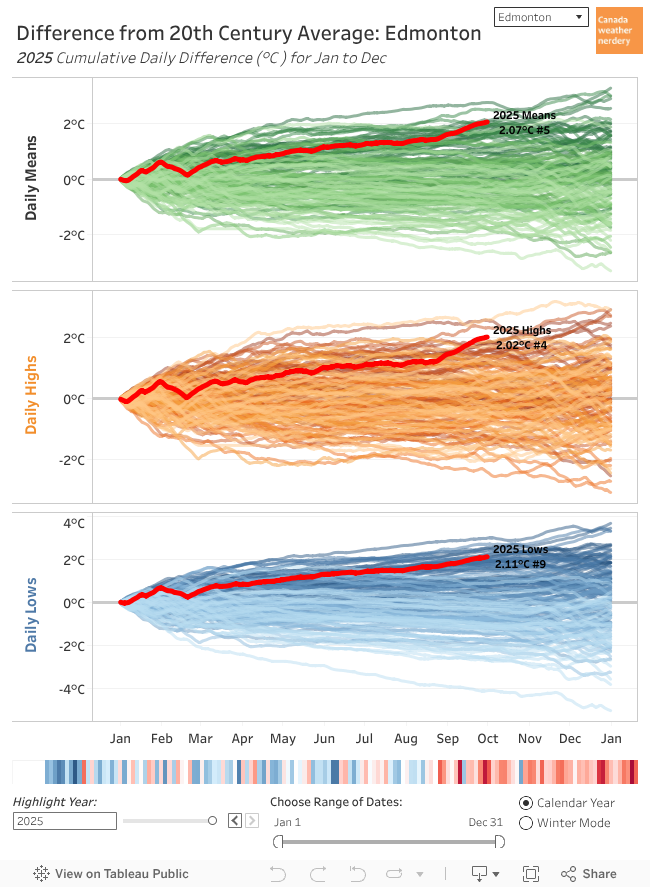 With 3 months left in 2025, its average temperature is currently our 5th warmest overall, at 2.1°C above the 20th century average.
The Horserace
That's due to a warm January (#13), May(#6), August (#5), and September (#1).
The Highs are our 4th warmest, and Lows are 9th warmest.
Warm & Cold Months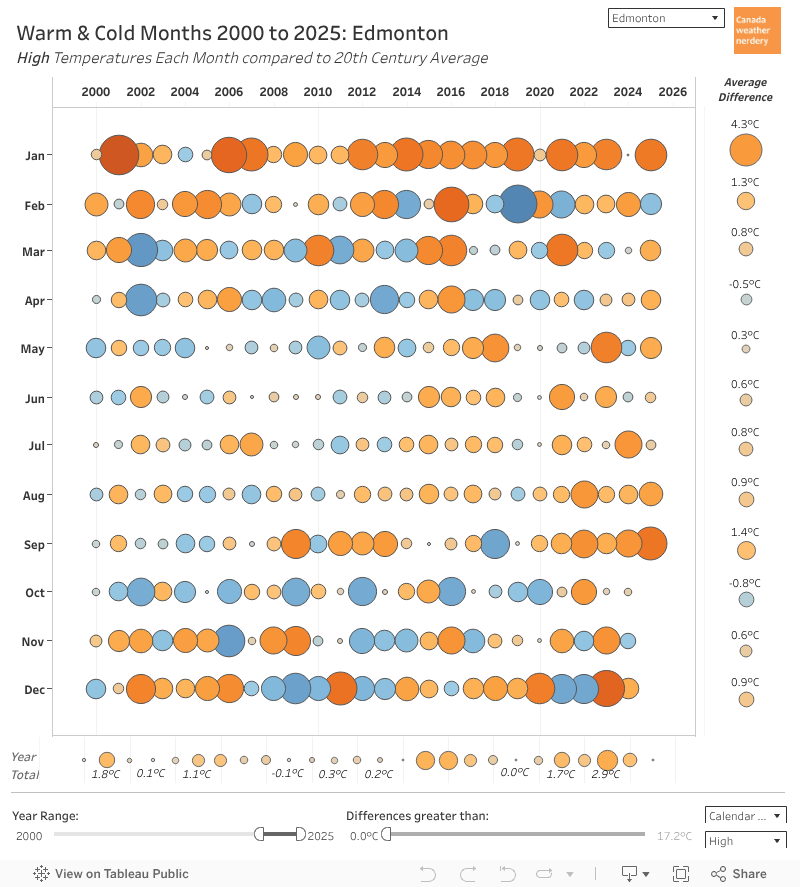 September 2025 was well above average, so it's a big orange bubble here.
The average High of 23.8°C was 6.9°C warmer than the 20th century average.
The average Low of 8.8°C was 4.2°C warmer.
September 2025 was well above average, so it's a big orange bubble here.
The average High of 23.8°C was 6.9°C warmer than the 20th century average.
The average Low of 8.8°C was 4.2°C warmer.
Across Canada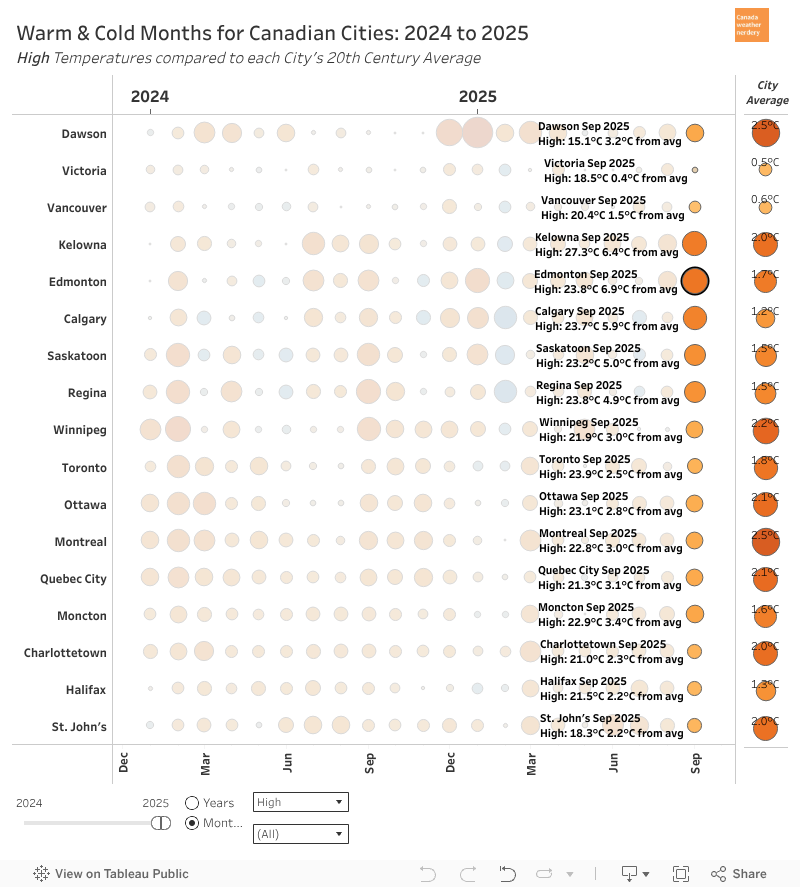 September 2025 another above-average month across the country.
Edmonton was at the top at 6.9°C warmer than the 20th century average. Victoria was at the bottom, at 0.4°C warmer than theirs.
September 2025 another above-average month across the country.
Edmonton was at the top at 6.9°C warmer than the 20th century average. Victoria was at the bottom, at 0.4°C warmer than theirs.
Precipitation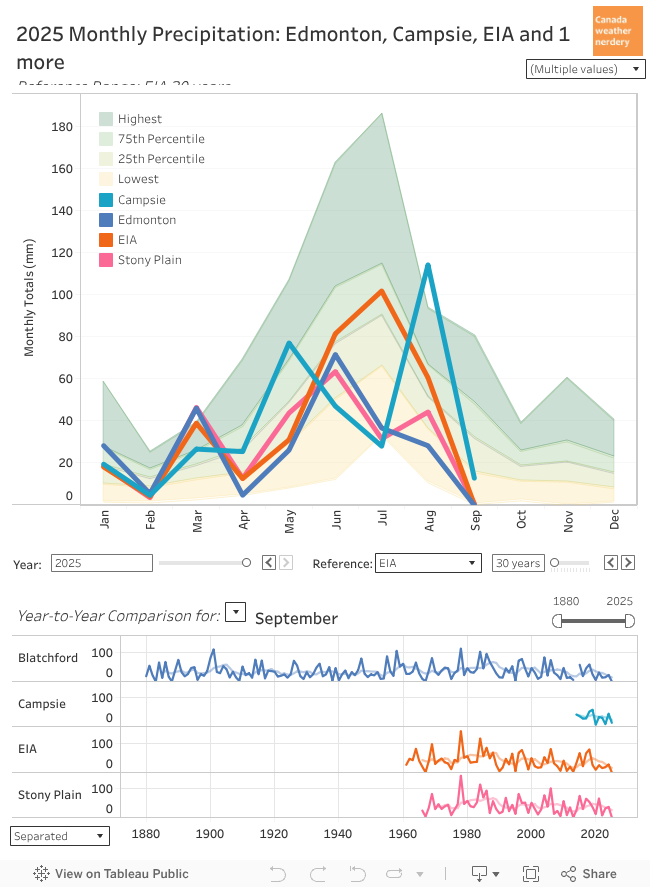 In September we average 32mm of precipitation, and 2025 was SUPER low.
Warm & Cold Months
Across Canada
Precipitation
The airport recorded 0.6mm (although it had quite a few missing records), Blatchford got to 0.9mm, and Stony Plain had 1.5mm.
Campsie (100km NW) got up to 13.3mm, but that's still well below average.
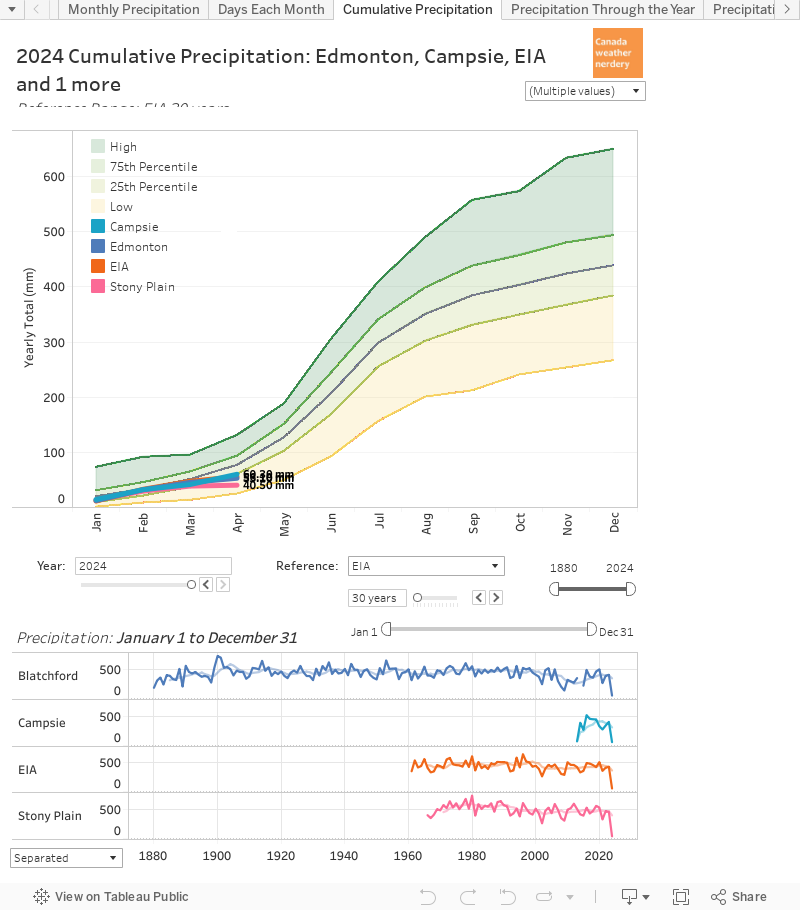 By the end of September we average around 377mm of precipitation for the year.
The dry September means that Campsie and the airport are a bit below average around 350mm.
But Stony Plain is way down at 267mm, and Blatchford is down at 250mm.
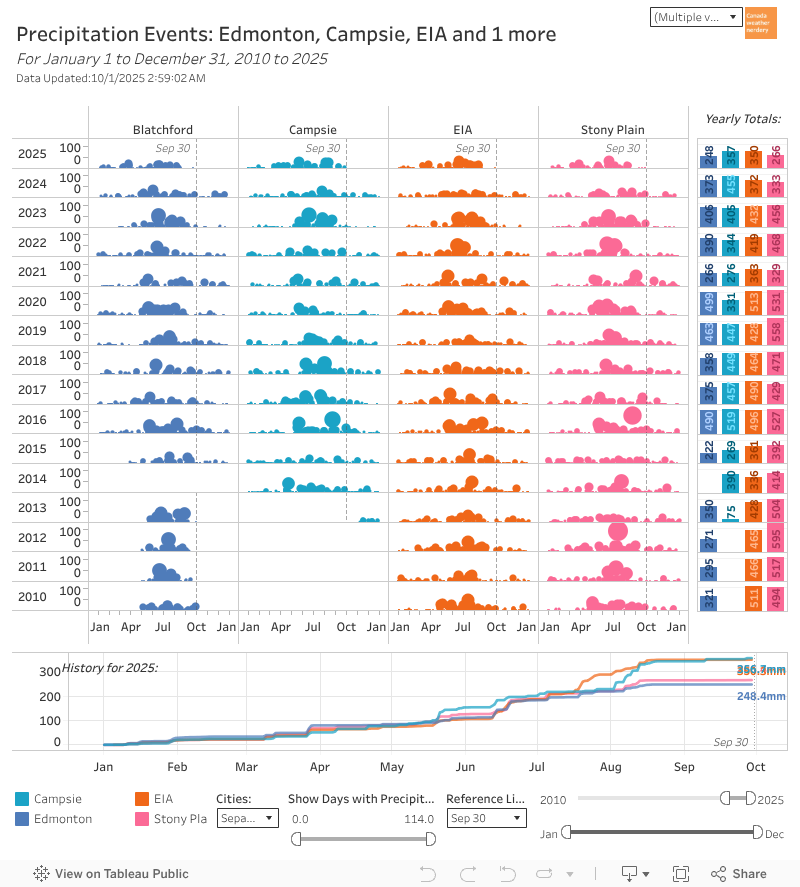 Storms? What storms?
By September our big summer storm season is over, but we still average around 10 days with Precipitation.
But not in 2025.
Storms? What storms?
By September our big summer storm season is over, but we still average around 10 days with Precipitation.
But not in 2025.
Snow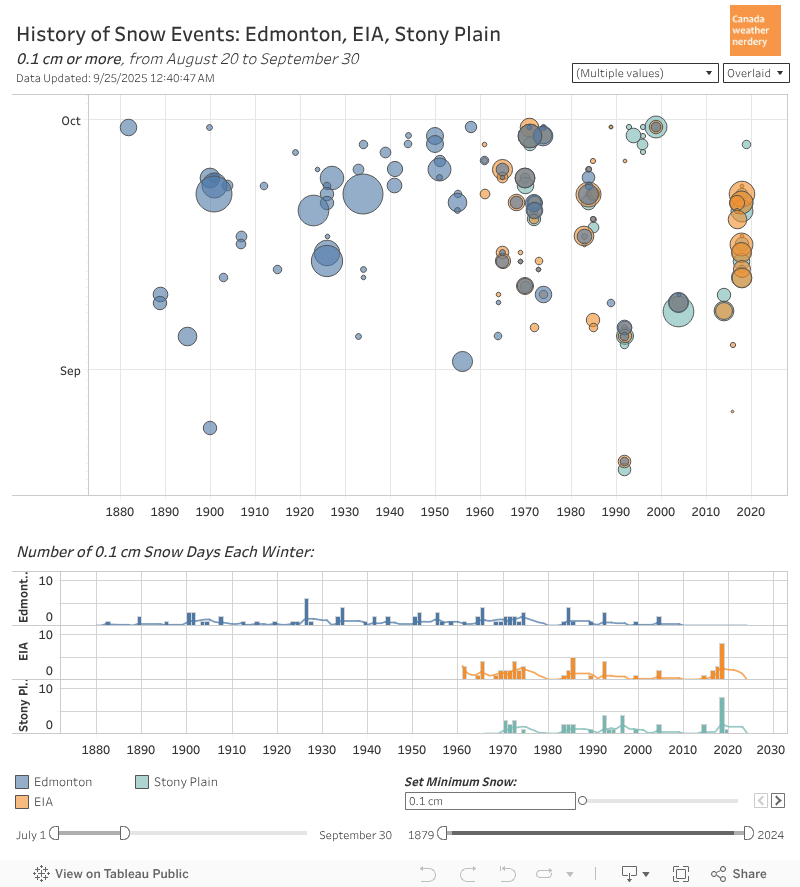 On the other hand, no September precipitation also means no September snow.
The last time that we recorded September snow was September 28, 2019 in Stony Plain.
And September 2018 was also very snowy.
On the other hand, no September precipitation also means no September snow.
The last time that we recorded September snow was September 28, 2019 in Stony Plain.
And September 2018 was also very snowy.
Precipitation Across Canada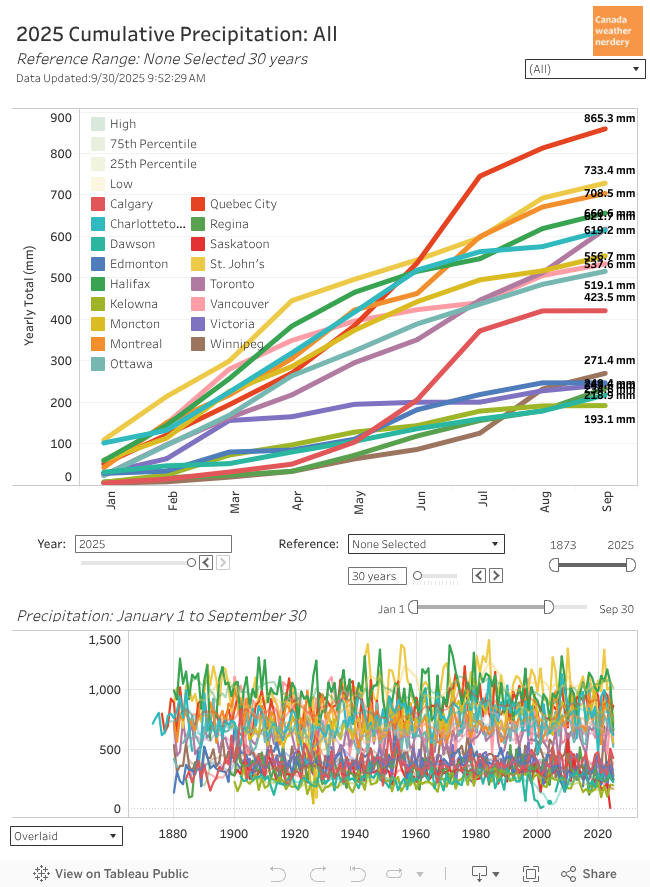 These are the precipitation totals for 2025 across the country.
Snow
Precipitation Across Canada
Quebec City is still way out ahead with over 865mm.
Montréal & St. John's are over 700mm.
And like Edmonton, Calgary recorded basically no precipitation (0.4mm) in September.
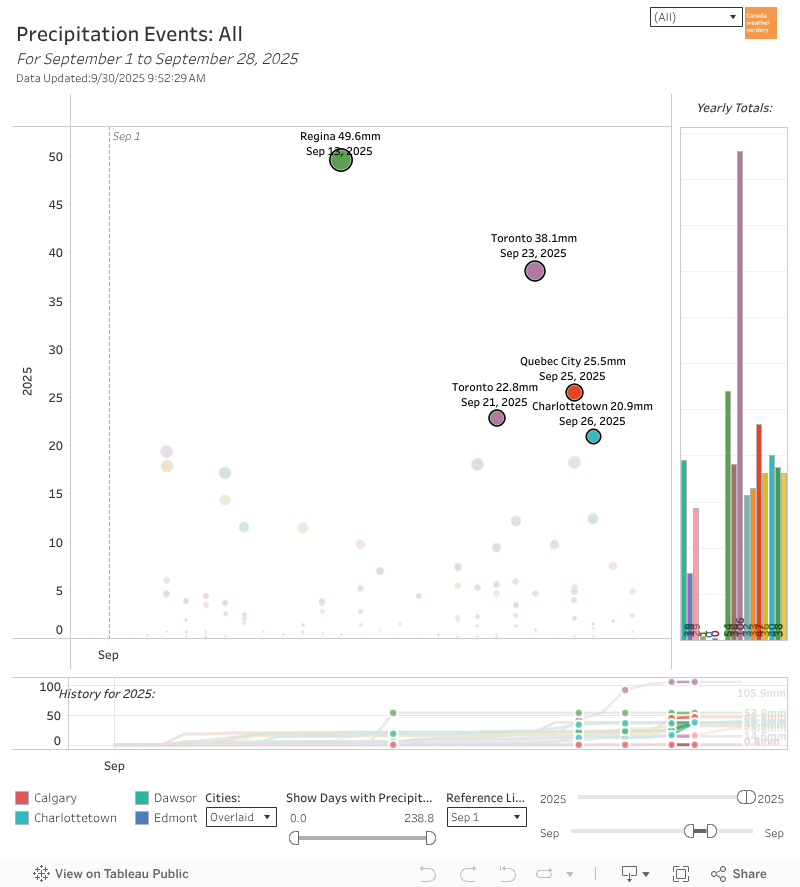 Across the country the biggest September storms were:
- 50mm in Regina
- 38mm & 23mm in Toronto
- 25mm in Quebec City
- 20mm in Charlottetown
October
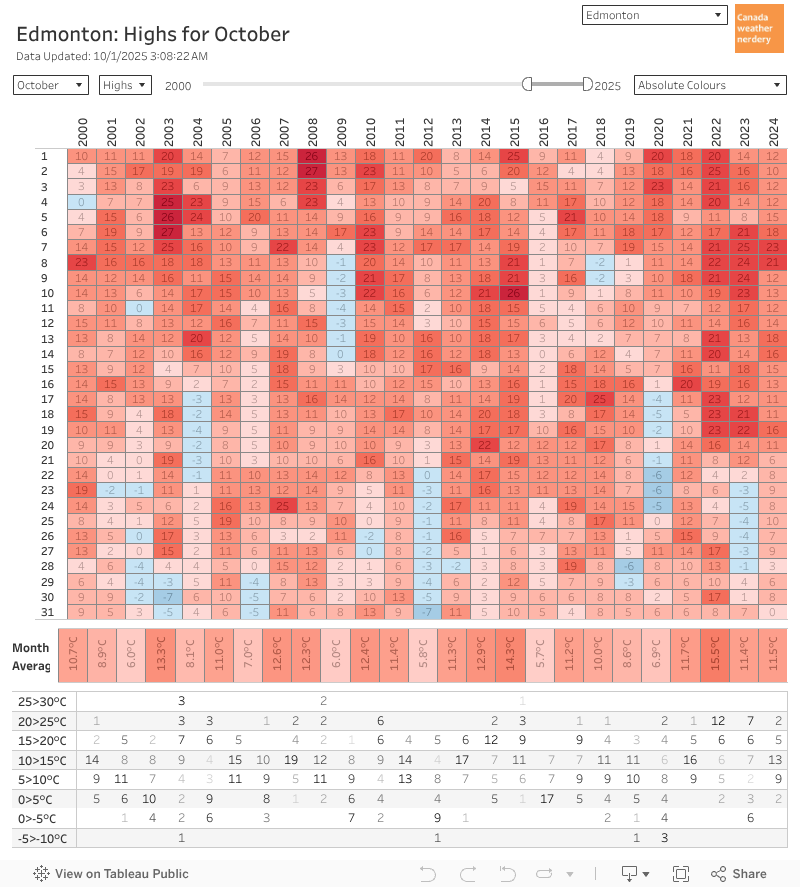
October also averages 2 Highs below 0°C, and 14 freezing Lows.
And...we get 7cm of snow on average in October, although 2021, 2022 & 2024 had none.