2018/01/31

January Review / February Preview

A chilly end to January makes it a little tough to remember some of the warm days that we had earlier in the month.

High Temperatures

Here are the high temperatures for January, and we started off warm, got cold, got warm again, and then got cold again.

We didn't set any records this month - either all time or recent - but on the 18th we did hit 8.6°C which was very close to the all-time record of 9.0°C from 2009. We looked at that heatwave in detail in Record Watch - January 17, 18 & 19.


I like to tell people that January always gets some warm days, and in the last 20 years the average has been 11 days with Highs above 0°C. This year we were just a bit below that with 10, and that included 4 Highs above 5°C.

We also had 3 Highs below -20°C, and the last time that we had that many cold Highs was in 2012.

Overall though, the average High for January 2018 was -4.3°C, and that's just a touch warmer than the 20-year average of -4.8°C.

Low Temperatures

Here we have the Low temperatures, with the familiar rollercoaster. We set a recent-coldest (since 1996) Low on New Year's Day, at -27.6°C, and then a recent-warmest Low on January 19th at -1.9°C.


The average Low for the month was -14.3°C. which was just a touch below the 20-Year average Low of -13.7°C.

The deepfreezes felt like they lasted forever, but honestly we were right about where we would expect to be. We had 9 Lows below -20°C including 3 below -25°C, and that's about as typical as it gets for January.

Warm and Cold Months

This chart could use some explanation, and for that it's probably easiest to go back to How Warm is 2017 - the Months. Generally though, it's showing how the average temperature for each month compares to the average for the 20th century, and also to the average for the last 5 years.

January was about 4°C warmer than the 20th century average for January's. But recent January's have all been pretty warm - the 5-Year average is 5.3°C above the 20th century. So January 2018 was warmer than history, but a little bit cooler than the last few years.

As this chart cycles through the years January 2001 really stands out, at 10.8°C above the 20th century average. If we look back to the temperature tables for earlier, we can see that that January had 25 Highs above 0°C, and the coldest Low was only -15°C,

Monthly Snow

January was pretty snowless, right up until the storm we got on the 25th, 26th and 27th. Those 3 days totalled 11.8cm, and that brought our total for the month to 15.1cm. That's a bit below the average of 21cm, but a bit above the 12cm that we got in January last year.

Cumulative Snow

For the winter so far, January brings our cumulative snow total to 60.5cm. That's just about where we were at this time last year, and below the average of 80cm.

Snowdepth

Here we have the snowdepths measured at the International Airport going back to 1995. We'd been pretty low so far this winter, although the storm at the end of the month bumped us up to about 18cm.

It's been a few years since we've had a really snow winter - 2010-2011, 2012-2013 and 2013-2014 all reached the 44cm-52cm range. We looked at that in more detail in Snowdepth - Part 2 - The Big Melt.


And here we can see how the snowdepths at the International and Blatchford compare to the average. The recent snowstorm pushed both stations up to around the average. Earlier in the month though, the International had been at 8cm while Blatchford was at 2cm.

In the past I've been suspicious of Blatchford's snowdepth measurements. We see an example of that here, because Blatchford jumped from 1cm of snow on the ground all the way up to 24cm, even though we only got about 12cm of snow during the storm. In comparison the International jumped from 8cm to 18cm, which is more reasonable. For these snow measurements I've always used the International as the main reference, and I will continue to do that.

This chart also shows the snowdepth last year, and it saw significant melting in both January and February.

February

And finally, here we have the recent history of February temperatures.

February is a lot like January, with usually 10-15 Highs above 0, and 5 Lows below -20°C. It's also on-average the least-snowy of the main winter months.

2018/01/26

Edmonton's Largest Snowfalls

Last year we looked at how often Edmonton gets giant snowfalls, and from recent history we saw that we get:

  • 10cm (4"): usually about 2-5 times per year
  • 20cm (8"): maybe every-other-year
  • 30cm (1'): none in the last decade, 3 in the last 30 years.
I was never completely happy with some of the charts in that original post, and so today we're going to take a second look.

Snowfall Events of 5cm or More

This chart shows every multi-day snowfall event with a total of 5cm or more, going back to 1880. Blatchford's snow records are shown in orange and they stop in 2006, and the International Airport's are in blue and they run from 1960 to today. 

One important distinction here is that this chart doesn't show one-day snowfall totals, but instead it takes consecutive days with snow and combines them into snowfall "events." The reason we're using this approach is because snow will often start in the evening and continue on through the morning. Environment Canada's numbers would split that across the two days, but it makes more sense to group them together. 

And so today we are going to define a Snowfall Event as: the total snow on consecutive days where each day received at least an inch (2.5cm) of snow.

There's also a caveat here for the "X Events" counter at the top of the chart, because it double-counts on days that Blatchford and the International both recorded large Events on the same day. I don't think that's a big deal since we're not trying to be particularly scientific, and we'll compare Blatchford and the International later on.

From this chart it's tough to discern any trends, and for that it's probably easiest to go back to the charts from last year:


This chart from last year shows the number of 10cm+ snowfalls each winter, and it hasn't changed much over time. There were a few years around 1900 with a lot of big snowfalls, but other than that 1-4 per year has been pretty typical.

In the post last year I think that we covered the trends (or lack thereof) pretty well. Today we're more interested in the big Events:

25cm or More

This version of the chart only shows the Events with 25cm of snow or more.

Edmonton's largest snowfall Events were: 
  1. 47.5cm over 3 days, from April 18-20, 1955
  2. 46.5cm over 5 days, from December 27-31, 1893
  3. 43.5cm over 3 days, from April 1-3, 1948
  4. 41.9cm over 3 days, from February 29-March 2, 1900
  5. 40.6cm on 1 day, October 25, 1885, and 40.6cm over 2 days on April 6&7 1991.
Most of those are multi-day totals, with the only single-day snowfall being the 40.6cm on October 25, 1885. A few other big days were November 15, 1942 with 39.9cm; May 2, 1886 with 38.1cm; and October 16, 1991 with 28.6cm.

The most recent 25+cm snowfall Event was 25.9cm over 6 days from January 12-17, 2011. And since 2000 there were only 2 other big Events: 35.2cm over 5 days from May 2-6, 2003; and 28.1 over 2 days on April 14&15, 2002.

1995-2017

Here we're looking at all snowfall Events of more than 5cm, since 1995. Because there is a bit more space the labels on this chart are for anything greater than 20cm.

There are 4 Events here where both Blatchford and the International recorded more than 20cm of snow: November 10 1996, April 15 2002, January 20 2003 and May 6 2003. Those dates have both the orange text and the blue text.

There are 4 other 20cm Events that happened after 2007, and so only the International has any data for those.

And then finally there were 4 Events where Blatchford recorded more than 20cm but the International didn't (although it was close twice), and 1 Event where International broke 20cm but Blatchford didn't.

Blatchford vs The International

This chart shows the 46 years where both Blatchford and the International were recording snow data, from 1960 to early 2007. It cycles between both stations, Blatchford only and the International only.

We can see that there's a lot of overlap between the two. Across these years Blatchford recorded 351 of these large events, with an average of 10.9cm. At the International there were 361 events, with an average of 10.2cm.

But we'll end off with one more graph from last year:


Today we've talked about large snowfalls - in the range of 5cm, 10cm, 20cm and beyond. And this chart shows how often they happen. At both Blatchford and the International almost half of the time when it shows we get less than 1cm, and we only get more than 5cm about 16% of the time.

2018/01/20

Record Watch - January 17, 18 & 19

We've just had a couple of pretty warm winter days, and today we're going to put them into context.

January 17

On Wednesday we hit a High of 6.7°C. That' was the 6th warmest January 17th recorded in Edmonton, down a bit from the 7.5°C we had last year in 2017. The record is 8.3°C set in 2009.

The Low of -5.2°C was well below the 0°C record for warmest-Low set in 1976.

January 18

Our High temperature this year on January 18 was 8.6°, which was a perfect match for last year which was also 8.6°C. So 2017 and 2018 both tied for 3rd place, behind 8.9°C in 1900 and 9.0°C in 2009.

The Low this year was -5.2°C, which is in about 10th warmest spot. In comparison, 2017's Low was -1.5°C. The record warmest-Low was 3.3°C in 1900 again, and the coldest was -43.9°C in 1886.

January 19

January 19th's High of 5.2°C put it in 13th place, well below the record of 10°C set in 1944.

The Low of -1.9°C was the 6th warmest, with 1891 holding the record at 2.2°C. The record Low for January 19th is -49.4°C set in 1886, which is the coldest temperature ever recorded in Edmonton. 3 days all share the honour of having records at -49.4°C: January 19 1886, January 21 1886, and February 3 1893.

Top 50 for January 15-21

And here we have the 50-warmest days recorded in Edmonton for the week of January 15-21st.

The lowest record for this week is 7.2°C for January 16, which was set way back in 1884. The highest is 10.7°C for January 20th set in 1981, followed closely by 10°C for January 19th set in 1944. The records for the other 4 days are all between 8.3°C and 9.1°C.

The grey shading breaks things out by decade, and so far the 2010's have 10 days in the Top-50 with entries in 2013, 2014, 2017 and 2018. The 1940s have 7 days, the 1890s have 6 days, and then the 2000s have 5. The cutoff for the Top-50 is 6.1°C, so our 5.2°C on the 19th this year doesn't make it in.

2018/01/13

2017-2018 Coldsnaps So Far

Today is the end of a short coldsnap, so we're going to check-in and see how the winter of 2017-2018 compares so far.

This is a followup to Coldsnaps & Deepfreezes from last year. And if you're interested in Edmonton's historic deepfreezes, please see It was the winter of '69.

Lows Below -20°C

This chart shows all of the days with Low temperatures below -20°C, going back to the unusually cold winter of 2010-2011. The number are how many continuous days were below -20°C.

This most recent coldsnap felt like it lasted forever, but it was really only 5 days. Looking back through recent years 5-6 days is a pretty typical length.

Between Christmas and New Year's this year we had 9 days with Lows below -20°C, and the last time we had a coldsnap that long was back in Dec/Jan 2010-2011.

So far this winter we've had 14 days below -20°C, and the average is about 23. We've already passed low winters like 2015-2016 with 6 and 2011-2012 with 10, but still have a long way to go before we catch 2010-2011 which had 48.

Lows Below -25°C

In our two coldsnaps so far this winter we've had 9 Lows below -25°C, which isn't a huge number, but which is more than most of the years here. The only recent winters with more were 2010-2011 with 16 and 2013-2014 with 17.

Highs Below -20°C

This year our two coldsnaps have also included two 3-day stretches of Highs below -20°C, and we hadn't had one of those since January 2012. And with 6 Highs below -20°C so far we're already above all these other years, except for 2010-2011.

Normally Highs below -20°C happen in December or January, but both 2011 and 2014 had 2 each in early March.

Highs Above 0°C

For a change of pace, here are our warm days so far, with Highs above 0°C. The numbers here are a little messy to read, but that's a good thing because it means that there are lots of them.

The 15 straight Highs above freezing that we just had in December was the longest mid-winter streak of all the years here. And with 32 days above freezing so far we're about halfway to the average.

Highs Above 5°C

And finally, here we have the days with Highs above 5°C. We'll hopefully see quite a few more of these as we get closer to spring, but with 13 so far we've almost caught 2012-2013. The 7-day streak in December was again on the long side of things for the middle of winter.

2018/01/06

January Rain

Back in November we looked at The Cold November Rain? to see just how frequently the International Airport received rain in the month of November.

Now it's January, and it's rained a little bit today. How often does the happen?


Here are all of the rain events at the International, going back to 1995. The Blatchford station tends to be warmer than the International and might get ran more often, but it doesn't break out rain vs. snow anymore so today we'll have to stick with the International.

We're just starting 2018, but 2017 recorded no rain in January. It's one of the relatively uncommon no-rain January's here, along with 1998, 2000, 2002, 2007, 2010 & 2011. Out of the 23 years here 16 had some rain, and 7 didn't.

2005 is the big winner here, with a total of 9.5mm, and both 2015 & 2016 recorded 4mm.

For a bit more context, here are the totals going back to the 1960s


This chart shows the monthly amount of rain as the blue bars, and then the total number of days with rain as the green. The 5-Year averages also appear as dashed lines to give a sense of how things have changed.

2005 with 9.5mm is the recent year with the most January rain, but 1971 beat that with 10.9mm, and 1965 came close with 9.4mm. And because of a string of rainy January's in 1965, 1968, 1969 and 1971 the 5-Year average was highest in the early 1970s.

For January with most rainy days 2015 is the leader, with 7 rainy days and a total of 4mm. The next closest is 2005 with 5 days.

The frequency of rain in January has changed a little bit over the years. In the 1960s & 1970s there were 9 January's with no rain, in the 1980s & 1990s it was 11, and since 2000 there have only been 6 (with only one more potentially in 2019).

2018/01/04

2017 in Review - Precipitation

In Part 2 of our 2017 Year-in-Review we'll be looking back at precipitation. In Part 1 we looked at 2017's temperatures.

For temperatures we usually use the Blatchford weather station, which is located near downtown Edmonton - and if you're interested in how temperatures differ between Blatchford and the International Airport, that's covered here.

But when it comes to precipitation, Blatchford is missing a few years of recent data. And so today we'll mostly be focusing on the International Airport, but if Blatchford's numbers are available then they will be included for comparison.

Days with Precipitation


To get things started, this chart shows the number of days each month on which precipitation - either snow or rain - was recorded at the International Airport.

This chart uses a format that we'll be seeing a lot of today, with the recent average as a white line in the middle, and it's surrounded by a band for the 25th-75th percentiles (where things will fall roughly half of the time), and that is surrounded by the recent extremes (highest, second highest, second lowest and lowest since 1995).

The blue line in this chart is the number of days with precipitation for 2017 at the International. April and November were the highest at 16 days, and April's total was higher than any other year since 1995. December was way down at 5 days, although in 1997 December only recorded 3 days.

The green dashed line is the number of days with precipitation at Blatchford, and it was 5 days higher in February, but then 3 days lower in April and October, and 4 days lower November.

Monthly Precipitation


This chart shows the monthly totals for precipitation for the International. Data from Blatchford is included as well, and the International's totals from 2016 are also here for reference.

In 2017 the month that had the most precipitation was July at 90mm, and that's typical. April was well above average (we talked about it here) and was the snowiest and overall soggiest April ever recorded at the International. September was also above average, although nothing record-breaking. In the first chart today we saw that November had 16 days with precipitation, but across those 16 days we only received 20mm of precipitation, and that is right around average.

Blatchford's precipitation is shown as the dashed green line. For the early part of the year it was a close match to the International, but from July onward Blatchford recorded quite a bit less.

Cumulative Precipitation

This chart shows how the precipitation totaled-up throughout the year.

Here we can see the gap that started to open up between the International and Blatchford around May. By the end of the year the International had received 489.6mm versus 376mm at Blatchford, for a difference of 115mm or about 30%.

Yearly Precipitation


This chart shows the history of yearly precipitation totals for the International. Blatchford is missing some of it's historical data, so it isn't included here.

At the International the 489.6mm for 2017 is just a touch below the 496mm it received in 2016. Both of those years were at the high-end of the recent range, although from the 1960s through the 1990s totals in the 500-600mm range weren't uncommon. Precipitation dropped a bit around 2000 though, which we had originally looked at here.

Yearly Snowfall


Switching over to snowfall, this chart shows the snowfall totals for each year back to 1880. It's a combination of data for Blatchford and the International, because Blatchford's data only goes from 1880-2007, while the International's is from 1960-today.

The total snowfall at the International for 2017 was 135.6cm, which is right around the longterm average. Some years are down at 50cm and others are up at 200cm, but the 100-150cm range is very common, and has been since at least 1900.

Monthly Snowfall


I normally like to think about snowfall in terms of winters, rather than calendar years, and so this chart shows the monthly snowfall for the winter of 2016-2017 as the dotted red line, and for the first half of 2017-2018 as the blue.

One of the unusual things about last winter was that most of the snow came in March and April. We just saw that 2017 recorded 135.6cm of snow, but 70cm of that was in March & April, with 43cm in April alone.

As we start the winter of 2017-2018 September and October were both snowier than normal, November was average, and then December was very low. With just 2.8cm of snow, December 2017 was the International's 2nd least-snowy December ever, after 2014 with 2.4cm.

Winter So Far


This chart shows how snowfall totals build-up over the winter (although it's not the same as snowdepth, which we'll look at next).

Our average snowfall total is about 125cm per year, and last winter we were a little bit below average...until the extremely snowy April pushed things over the top. So far this winter we're close to the average, although the mostly snow-less December means we've fallen behind a bit.

Snowdepth So Far


This chart shows the snowdepth at the International and Blatchford. The November-December chinook caused a lot of melting, and Blatchford now sits at 2cm while the International is at 9cm.

Looking at last winter as a comparison, it started off later, but saw significant melting in January, February, and then was snow-free by mid-March, before April threw a bunch of new snow at us.

Precipitation History

Finally we'll end off on this 3d chart of all the precipitation at the International Airport since 1995.

This chart isn't the easiest to read, but I think it does a nice job showing just how dramatic our precipitation is during the May-August monsoon season compared to the rest of the year, and especially compared to the winter months.

If you're interested in comparing 2017 to 2016 last year's write-up can be found here.

2018/01/02

2017 in Review - Temperatures

Today is Part 1 of Edmonton Weather Nerdery's 2017 Year-in-Review, and we'll be looking at the year's temperatures. In Part 2 we'll focus on precipitation.

The charts today are all ones that have been used in the past, and since some of them can be complicated there will be links back to the original posts that have full explanations.

High Temperatures

Here we have the High temperatures for the year.

The colourful stuff in the background of this chart is the range of temperatures that have been recorded since 1996. The average high for each day is the white line in the centre; it is surrounded by a grey band for the 25th-75th percentiles (where temperatures will fall roughly half of the time); and outside of that are the warmest temperatures since 1996 in orange and the coldest in blue. And finally, the all-time warmest and coldest temperatures going back to 1880 are shown as the faint lines that are furthest from the average.

In 2017 we set four all-time records for warmest-High - on February 15, May 5, September 7 and September 11. If breaking 4 all-time records in one year sounds like a lot, we looked at that earlier this year in How Often Does Edmonton Break Temperature Records?

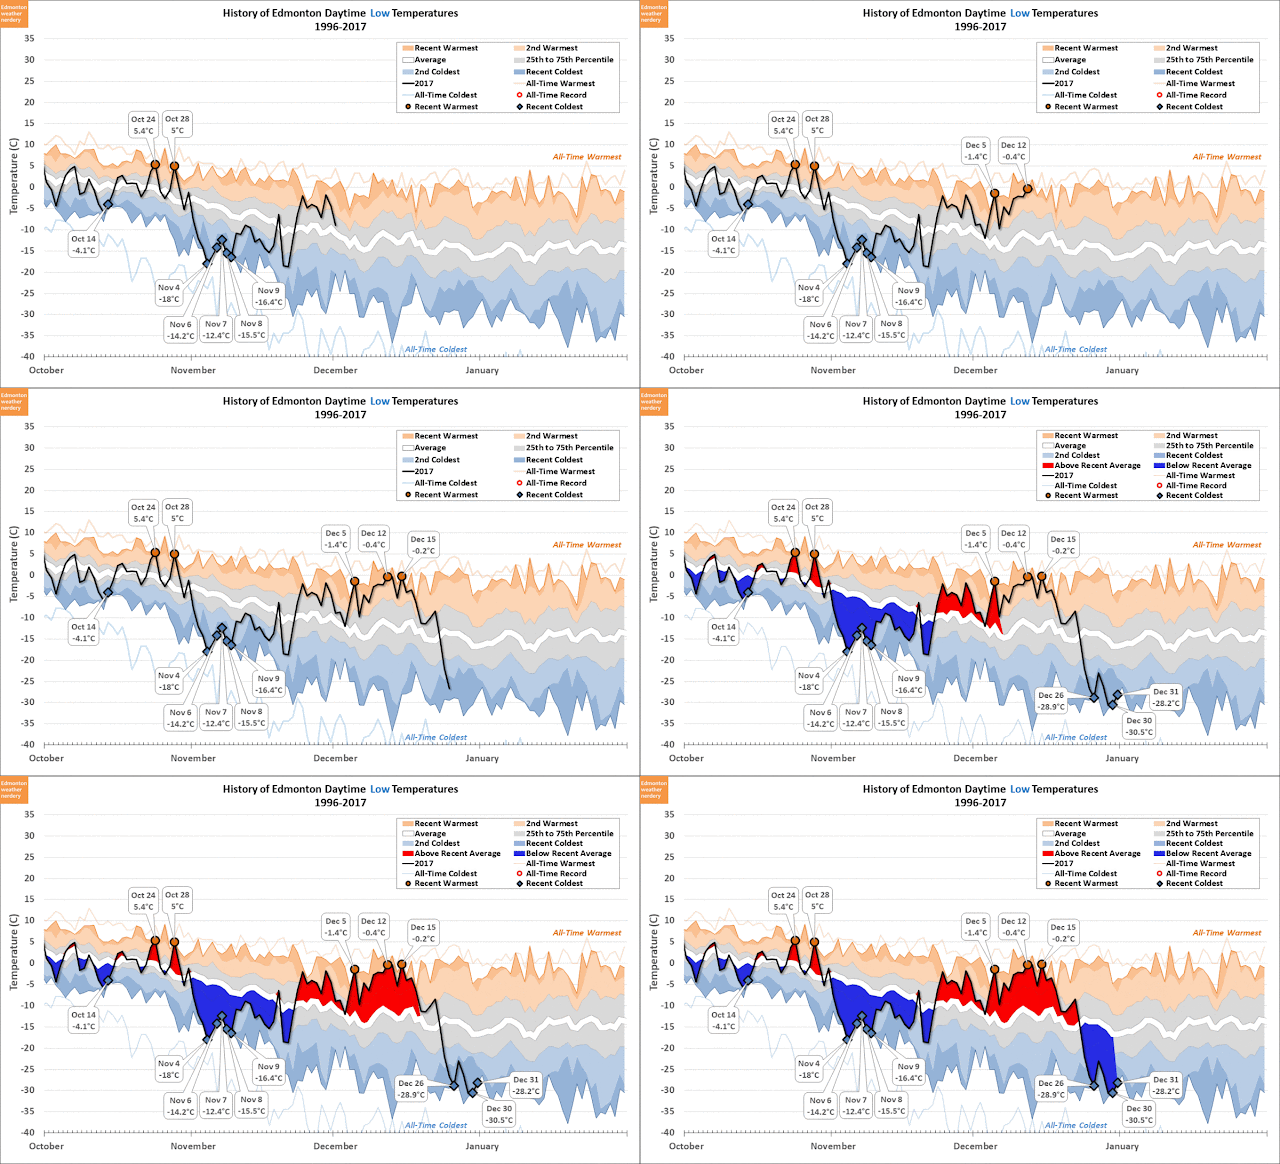
In addition to the all-time records, the orange dots in this chart also show warmest-since-1996 records, and there were 22 more of those. We didn't set any all-time records for coldest-Low (that doesn't happen very often), but we did set 15 coldest-since-1996 records which are shown by the blue diamonds. 3 of those were during the late-December deepfreeze, 5 were during the early-November coldsnap, and the rest were scattered throughout the year.

The Red & Blue highlighting in this chart shows days that were above or below average. With that we can see the many swings from coldsnap-to-heatwave (or visa versa) that happened in January, February, March, May, September, November and December.

Low Temperatures

Here we have the Low temperatures.

2017 set 6 all-time records for warmest-Lows, on May 5, June 8, August 21, August 28, September 8 and September 27. In addition to that there were 22 other warmest-since-1996 Lows, and 13 coldest-since-1996 Lows. 3 of those coldest-since-1996 Lows were between Christmas and New Year's, and 5 were in early-November.

How Normal is Average?

Looking at 2017's temperatures you might think that they bounced around from warmspells to coldsnaps, without much time spent at the average. And that's pretty typical.

This chart cycles through the High temperatures for the last 5 years, and we can see that every year spends a lot of time near the extremes. We looked at this in detail earlier this year in How Normal is Average? and saw that about 58% of the time we're within ±5°C of the average.

The Horserace

So how does 2017 compare to other recent years?

For a full explanation of this chart it's easiest to refer back to the original discussion of it in How warm is 2016? (September Edition). Generally though, it tracks how much warmer each day of the year was compared to the 20th century average - warm days get points and cold days lose them.

The blue and orange background is the range of all the years going back to 1880, and they are grouped together like that because showing each individual year gets too messy. To keep things simple the last 10 years are shown here as a reference.

So how warm was 2017? Using this metric it was Edmonton's 16th warmest-ever year. Recently 2015 and 2016 were both very warm, in 3rd and 4th spots respectively. 2017 falls well below them, but above every other year since 2007.

When we follow the red line we can sortof see all of the warmspells and coldsnaps: a bumpy January through May; a fairly steady climb through to September; a major dip for the unseasonably cold early-November; a climb back up during our December chinook; and then one final drop for the end-of-December deepfreeze.

Warm & Cold Months

Here we have one more summary of how 2017 breaks down, this time on a monthly basis. The full explanation of this chart was in How Warm is 2017 - the Months.

January was our most above-average month, at 5.4°C above the 20th century average. That's partly just luck though, because January started out a little cool, before finishing off warm, including 8 days above 5°C.

I say that January is lucky because many other months - February, March, November and December - also had heatwaves, but they were balanced-off by deepfreezes, and so when we look at the month as a whole the numbers are more moderate. December is still fresh in our minds, and the first 2 weeks were extremely warm, while the last week was very cold, and together those put December at 3°C above the 20th century average.

Warm & Cold Years

And all of that adds up to this chart, which is the full list of Edmonton's warmest and coldest years.

The explanation for this chart is in Edmonton's Warmest Years, but it is essentially averages all the temperatures for an entire year, and then compares that to the average for the 20th century. The reason I've used the 20th century average in several of the charts today is because this chart is based on one from the National Oceanic and Atmospheric Administration, and they use the 20th century average as their baseline.

2017 is in 16th place, overall and was 1.6°C warmer than the 20th century average. 2015 & 2016 were both warm El Niño years at 2.5°C and 2.9°C respectively, so 2017 is down from there. But it's just a bit below 9th and 10th place 2006 and 2005 at 1.9°C and 1.7°C, and 1999 was just a touch above it in 15th place.

This chart also shows the 5-year average, which really shot up in the mid-1970s and has stayed high ever since.

Really Cold Days

In terms of really cold days, 2017 had:
  • 23 days with Low temperatures of -20°C or below (8 were in the last week of December)
  • 11 at -25°C or lower (6 were in December)
  • 2 at -30°C or lower (both in December)
2017 had more cold days than 2015 and 2016, which were both affected by a warm El Niño. The dotted red line in this chart is the 5-Year average, and compared to that (and to the "typical" years of 2008~2014) 2017's cold days were pretty much what we would expect.

And that's it for the 2017 Year-in-Review Part 1. Later this week in Part 2 we'll look at 2017's Precipitation.

2018/01/01

December Review / January Preview

Today is going to be quick, because we'll be doing a big 2017-in-Review later in the week that will cover a lot of the typical month-in-review stuff. So lets dive right in:

High Temperatures

It was a pretty dramatic month, with two really warm weeks to start, and then one really cold week to finish off the year.

December 2017 set three records for recent (since 1996) warmest-Highs on the 7th, 10th, and 15th. The 10°C on the 12th came really close to breaking the all-time record of 10.6°C that was set all the way back in 1880, but it didn't quite make it.

After that, as we plunged into the deepfreeze we set three more recent records for coldest-Highs, on the 26th, 29th, and finally on New Year's Eve.


When we look at the numbers there were 17 Highs above freezing and 9 above 5°C, which puts 2017 up there with some of the warmest recent Decembers, like 2011 and 2002. 1999 is still the standout for warm, recent Decembers though, with 22 Highs above freezing.

But then on the cold side of things, the 7 Highs below -15°C and 3 below -20°C put 2017 down with some of the coldest recent Decembers, like 2012 and 2013. 2009 was probably that harshest recent December with 6 Highs below -20°C.

The average High for 2017 was -3.2°C, which is right in the middle, and that makes a bit of sense since this was both an extremely warm and an extremely cold month.

Low Temperatures

The Low temperatures look pretty similar, with 3 recent warmest-Lows earlier in the month, and then 3 recent coldest-Lows later on. 

The City of Edmonton cancelled its outdoor New Year's Eve activities this year, and at 28.2°C this was the coldest New Year's Eve since 1984 which dropped to 29.3°C.


Looking at the numbers for the Lows, our month-end deepfreeze had 8 Lows below -20°C, including 6 below -25°C and 2 below -30°C. And that's pretty comparable with the coldest deepfreezes that we see here, in 2013, 2009 and 2008. The one big distinction about the 2009 deepfreeze was that it dropped all the way to -37°C on December 13th.

Snow

We won't talk about snow or precipitation too much today, because we'll be covering that as part of the 2017-in-Review.

But in December the International Airport recorded 2.8cm of snow. That made 2017 the Airport's 2nd least-snowy December ever, after 2014 with 2.4cm. Some other low-snow Decembers were 1997 at 2.9cm, 1982 with 3cm, and 1993 with 4.2cm.

January Highs

As we head into January, it's good to remember that on-average we get 11 days above freezing every January. Since 1999 there have been a few low years like 1999 with 4 days and 2005 with 5, but there are other years that have lots of "warm" days like 2001 with 25, 2012 with 17 and 2014 with 16.

January Lows

But on the flipside, January can also be a month for deepfreezes.

As of New Year's we're just finishing 9-straight days with Lows below -20°C, and of the 19 years shown here 11 of them had something similar to that in January. So Happy New Year!