2016/07/31

July Review / August Preview

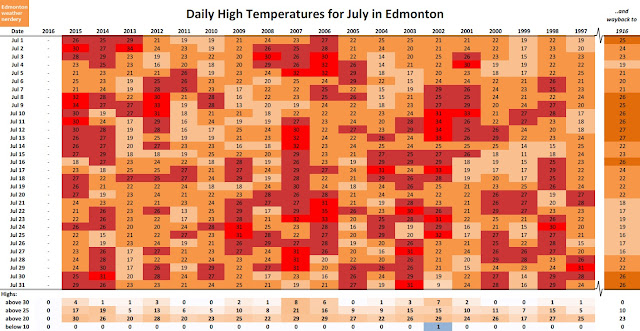
So after 5 very warm months, we finally get a pretty normal one with July:


About 3/4 of the time we'll have some days above 30°C, but this year we had none. And we had 9 days above 25°C, which is a bit below the recent average of 11. We did nearly have every day above 20°C which hasn't happened in the last 20 years, but the 31st just missed it by topping out at 19.3°C.


There isn't too much exciting for the lows, with most nights staying between 10°C and 15°C

I'd mentioned in an earlier post that July 22 is the point where Edmonton's temperatures start heading down again, and we can see that with the quartiles:


This July didn't have any days near the 20-year highs, but it did have 11 days below average. For the most part, the month was nicely stuck in the 25th-75th percentile band.


And the lows tell a similar story, with 9 days below the 20-year average, and one day that was close to the max.

Plenty of people have also been talking about the rain that we received in July, and I'll be back with a special post about that in a few days.

As for August:


The highs should be pretty similar to July, but we're definitely on a downward trend. We only hit 30°C about 1/2 the time in August, compared to 3/4 for July. The average number of days above 25°C is 10, compared to 11. And average days above 20°C is 22 down from 25.


For the lows, we should start to see more nights in the 5°C to 10°C range, and maybe one or two below 5°C.

2016/07/28

August Long Weekend

Today is just a quick look at August Long Weekend weather for the last 20 years.


Temperatures are normally pretty nice, with an average high of 23°C and an average low of 12°C.

2015 was the warmest August Long weekend in the last 20 years, with all four days above 25°C. The coldest was back in 2002, when only one day broke 15°C. And there are plenty of upper 20°C days, but only 2 days that broke 30°C.


In terms of precipitation, almost every year has had at least one day with rain. But for the last few years the overall totals have been pretty low, staying around or below 5mm over the four days.

2016/07/21

July 22 - It's all downhill from here.

And we're done.

It's a little tough to pick exactly which date is the top of Edmonton's yearly temperature rollercoaster, but July 22 is about as close as it gets.


Of all the various historic temperatures - highs, lows, averages, quartiles - they all turn around either today or tomorrow. Those horizontal lines on the charts are just there to make it easier to line-up the July 22 values against the other days.

Now we start heading down-down-down until roughly January 29 when things will bottom out. Overnight lows below freezing are 2-3 months away, and daytime highs below freezing are 3-4 months out. Make the most of the summer, everyone.

2016/07/10

versus - Calgary: Part 2; This Time It's Precipitation

It's stampede week down in Calgary, so it's time for another Battle of Alberta. Today: how does precipitation compare for Edmonton and Calgary?

A few weeks ago I did my first comparison of the two cities, which looked at the high and low temperatures throughout the year. The short version: Calgary's winter days are warmer; its winter nights are about the same; its summer days are about the same; and its summer nights are colder.

For Part 2 I had planned on digging into those temperatures a bit more, but that would have meant looking at things like days below -30°C, and that felt a little too wintery for early July. I will do that comparison eventually, but for today I think that precipitation makes more sense, since I've been looking at it a lot recently.

This will be a quick run-through of all the same charts from the past few weeks, but with Calgary data added on top. If you are curious about any of these charts, they are explained in more detail in the original posts.

I actually have no idea what to expect from this. I tend to think of Calgary as being drier than Edmonton during the summer, but I don't know if that is true or not. And we have seen that during the winter Calgary will have more days with melting, but I don't know how the total amounts of snow compare.

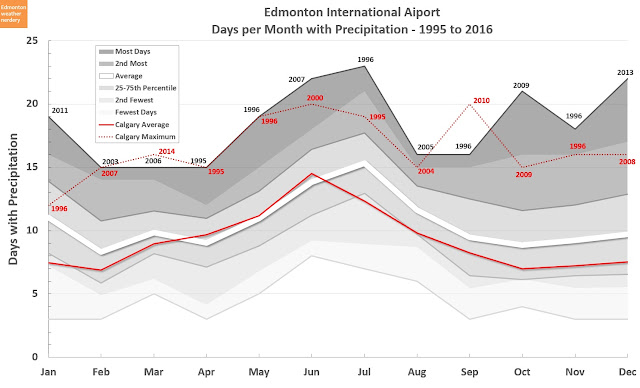
So to start with, here are the number of days with precipitation:


For most months of the year Calgary typically has fewer days of precipitation than Edmonton. April, May and June are about the same for the two cities, but for October through February Calgary's numbers are quite a bit lower.


Even though the number of days with precipitation is different, the actual volumes are quite similar. The most notable part of this graph is when the two cities peak - Calgary's maximum is June, while Edmonton's is in July. For the rest of the year the averages are very close, although Calgary is a little bit lower in January. And Calgary apparently had a very rainy June in 2005.

Breaking things down a bit more, here are the weekly numbers:


And the weekly numbers are pretty close throughout the year, again with the exception of June and July.

On the subject of stampede, it takes place in the 1st~2nd week of July when Calgary's precipitation has dropped off quite a bit from the June maximum. In Edmonton, K-days is the 3rd~4th week July which isn't quite the rainiest week, but it's pretty close. Just based on the averages, K-days will typically get 50% more rain than stampede (although a lot of that could be evening thundershowers).


Here is how the precipitation adds up over the year. Across 12 months the averages for the two cities are almost identical. Calgary's biggest accumulation happens in June while Edmonton's is in July, which we had already seen in the monthly graph. And at least for the years from 1995-2015, Edmonton's highest year totaled 100mm more than Calgary's.

All of the charts so far have been for recent history using data from 1995-2016, but here is a comparison of the entire recorded history of the two cities:


This chart shows the snow (in equivalent mm of melted water) and the rain for the two cities. Next winter I will take a closer look at snowfall, but for now we can see that it is similar for the two cities, averaging 125mm in Edmonton and 150mm in Calgary for the last 20 years.

All the variation in the yearly data makes it hard to really compare the two cities with this chart. So  here are the 5-year averages to smooth things out a bit:


A few weeks ago when I was looking at the Edmonton data I had mentioned that it was difficult to spot the 1930s drought - 1929 is low and 1930 is lower, but it recovers after that. With Calgary it is more apparent, with the average dropping down below 400mm for most of that decade. But Calgary's low precipitation during the 1930s is actually fairly typical, and is roughly the same as its numbers from 1960 all the way through 2003.

In previous posts we had also seen that since 2000 Edmonton's precipitation has dropped down from the 20th century average. Calgary is the opposite, having sat at around the 400mm/year range from the 1960s through 2003, but jumping up to the 450mm mark for the last decade. From 1970 through 2000 Edmonton had averaged about 50mm/year more than Calgary, but for the last decade the two cities have switched places.

So one of the earlier charts today showed that in the last 20 years the average yearly precipitation for Edmonton and Calgary has been almost identical. But looking more closely we see that things are a bit more complicated, with Edmonton being up for one decade and Calgary being up for the other, and the two balancing out over 20 years.

2016/07/01

June Review / July Preview

It's time for a familiar refrain: we've come to the end of another warm month.


In terms of daily highs, June 2016 was second place after 2002. Almost the whole month was above 20°C, with 26 days breaking that mark. But we didn't have a single day that cracked 30°C.

Back in May we had 15 days above 20°C and 6 days above 25°C, and at the time I'd said that was about typical of June. But this June was still a lot warmer than this May.

Since I started this blog, every month I give a short summary, and here is a recap of all of them:

  • January: not as many cold days as normal, but not as many warm ones either
  • February: tied for warmest, with 2002 
  • March: second most days above freezing, after 2010
  • April: top-3, and similar to 2005 and 2006
  • May: more days above 25°C than in any of the last 20 years
  • June: second warmest after 2002

Outside of January, there's a definite theme there, with 2016 consistently ranking in the top one, two or three of the last 20 years. In a few weeks I'll take a closer look at just how warm 2016 has been.


In terms of lows, we had no nights below 0°C or 5°C. But 2002 and 2006 both had more warm nights.

As for July:


Most years will have a few days above 30°C. And we're often very close to having everyday break 20°C, but even last year which was the closest had one day that only reached 18°C.

For a sense of how things have bounced around over the last month:


May was really a rollercoaster - swinging from highs to lows and back again. But June mostly settled down, with a few well-above-average days at the beginning of the month. After that though, temperatures stayed mostly between the 25th and 75th percentiles. There were only 5 days with highs below the 20-year average, and 8 days with below-average lows.

According to climate scientists this historic El Niño has just ended, so we'll have to see how things change in the next few months.