Showing posts with label 136 Years of.... Show all posts

2019/01/09

2018 in Review - Part 3 - Snow

This is Part 3 of our 2018 Year-in-Review, and we will be looking back at last year's snow.
  • In Part 1 we looked at 2018's temperatures.
  • In Part 2 we looked at 2018's overall precipitation.

For temperatures we usually use the Blatchford weather station which is located near downtown Edmonton. But the Blatchford weather station stopped recording snow in 2007, and so for today we will mostly be using the data from the International Airport. If Blatchford's historic numbers are available then they will be included for comparison.

In our 2018 in Review - Part 2 - Overall Precipitation we had ended things by looking at how Edmonton's precipitation each year is split between rain & snow, going back to 1880:


For total precipitation 2018 was just a little bit above average with 464mm. And since about 1900 Edmonton's average total precipitation at both Blatchford and the International has stayed in the range of 400-500mm.

And now, let's talk about snow:


Yearly Snowfall History

Here we have the snowfall totals each year for Blatchford (1880-2007) and for the International (1961-today). In this chart there is a darker grey section from 1961-2007 when both stations had reliable data, and that darker section is the difference between the two stations. In some years Blatchford was higher, while in others it was the International.

For 2018 the total snowfall at the International was 165cm. That puts 2018 in 10th place for the International, and the most snow since 187cm in 2013. But it is well below some of the really big years like Blatchford's 287cm in 1935, or 225cm in 2003.

On average we get about 125-130cm of snow each year, and that has stayed reasonably consistent since about 1900 or 1920. This year's 165cm was above that, mostly because of a ridiculous September.


Monthly Snowfall

Here we have the snowfall each month for the last year-and-a-half.

Normally when we talk about snow we split it into Winters rather than Calendar Years. And so for most of the charts today the calendar year 2018 will be split between the back-half of the winter of 2017-2018 and the front-half of the winter of 2018-2019.

This chart uses a format that we will be seeing a few times today, with the recent average as a white line in the middle, and it is surrounded by a darker-blue band for the 25th-75th percentiles (where things will fall roughly half of the time), and that is surrounded by the recent extremes (highest, second highest, second lowest, and lowest since 1995).

The spring of 2018 wasn't particularly snowy - March was a little high at 28cm, but April only had 12cm. In May we didn't get any snow, and that only happens about half of the time.

The fall of 2018 was more interesting. In September 2018 the International got 38cm of snow, while its previous record for September was 13cm from 1965, and Blatchford's record was 28cm from 1926. That also made September the snowiest month of the year for 2018, and that had never happened before. We talked a lot about our record-breakingly-snowy September here.

October's 8cm was right on the average, although about 1/4 of the time we make it through October without recording any snow. November's 17cm was a bit below the average of 20cm. December's 31cm was quite high at about double the average of 16cm, but still well below a year like 2009 which had 46cm.


Days with Snow

Here we have the number of snowy days each month, and 2018 is again split into January-June in Red and July-December in Blue.

For the end of the winter of 2017-2018 the months were typically-snowy, although March was a little high at 11 days compared to an average of 9.

For the first half of the winter of 2018-2019 the story really was September, which had 8 snowy days when the previous record was 5. October was also pretty unusually snowy with 6 days, although that was below 2008's 9 days.


Cumulative Snowfall (so far...)

Here we have the cumulative snowfall as it adds up over the winter, and 2018 is again split into January-June in Red and July-December in Blue.

For the end of 2017-2018 the snowfall was pretty average, with the red line tracking the line for the average very closely.

For 2018-2019 things got off to an early start with the very snowy September. Since then things have been more average, but overall the total for this winter is still very high because of that initial boost from September.


Large (5cm+) Snowstorms

In this chart each of the bubbles represents a large snowstorm that dumped at least 5cm+ onto the International Airport. These are not necessarily single-day snowfalls, because sometimes snow falls over the course of a few days. We talked about this more (and looked at records) back in Edmonton's Largest Snowfalls.

Here 2018 is again split between the back-half of 2017-2018 and the front-half of the winter of 2018-2019. The large snowfalls from 2018 are labeled in red, with the total snow, the number of days, and the end date.

A few years ago we looked at how frequently Edmonton gets giant snowfalls, and we saw:
  • 10cm (4"): usually about 2-5 times per year
  • 20cm (8"): maybe every-other-year (our last one was 24cm in the middle of April 2017)
  • 30cm (1'): none in the last decade, 3 in the last 30 years.

In 2018 we had a total of 11 5cm+ snowfalls.
  • The largest was 21.9cm over 3 days at the beginning of December.
  • We had 6 more storms in the range of 10-16cm.
  • And then there were 3 more from 5-10cm (although 2 of those were 9cm and 9.8cm, so almost 10cm, but not quite)

So 2018 had a total of 7 10cm+ snowstorms, plus 2 more which were right below the cut-off. That is not record-breaking, but it makes 2018 one of our more snowstormy years.


Snowdepth So Far

This chart shows the snowdepth measured at the International, and 2018 is split into January-June in Red and July-December in Blue.

Looking at the red line for last winter, normally our big spring melt starts in the first 2 or 3 weeks of March. We talked about that here. But March & April of 2018 were both really cold, and so we held onto the winter snowpack for a long time. Things didn't start dropping until mid-April, which was the latest of any year since 1995. We reached 0cm on April 21st which is pretty late, but was still earlier than years like 2013 (April 27), 2011 (April 29), or 1992 (May 2).

In the fall the blue line was off to an early start in October, then it took a break for a few weeks, and then it came back right at the beginning of November. The 21.9cm storm at the beginning of December pushed the snowdepth way up, but a lot of that melted-off during the warm December. By the end of the month our snowdepth was sitting at 22cm, which was just above the 75th percentile, and well above the 9 cm that we had at the start of 2018.


The Spring Melt

Here is another look at the spring melt of 2018, and it was not the latest year here, but it got a very late start.

After the snow hits 0cm for the first time there is always the chance of some more late, spring storms, but the snow from those usually only hangs around for a few days.


Autumn Snow

And here is the snow on the ground for the fall of 2018.

2018 was the only recent year to start October with almost two weeks of snowcover. That melted-off and then we were snow-free for a few weeks, but then the lasting snow showed up at the beginning of November.


This chart shows all of the snowfalls from September 1st through December 31st at the International Airport. The bubbles in orange show snow that melted-off, and the bubbles in blue are for once snow started to hang around. We looked at this in more detail in First & Lasting Snow.

2018's first snow on September 18th was quite early, and actually 2014, 2016, 2017 and 2018 all had September snow. The last time that 3 years in-a-row had September snow was 1983-1985, and the last time it happened in 4-out-of-5 years was way back in the early 1970s.

2018's lasting snow arrived on November 1st, which was one day later than in 2017 when it arrived on Halloween. Both of those years were early~ish, although about half of the time we get our lasting snow in the last week of October of first week of November.


From Spring Melt to the First Lasting Snow

This chart tries to show how long Edmonton is snowfree for each year, and it gives us two different choices for what exactly "snowfree" means:

  1. Snowfree could mean between when the winter Snow first melts down to 0cm to when we get our first lasting snow. This ignores any late-spring or early-autumn snowstorms, because most of those will melt off quickly.
  2. Alternatively snowfree could be more strict, and it could mean from the very,very last snow on the ground in spring to the very first snow of autumn.

In 2018 the snow first melted down to 0cm on April 21st, which is 3 weeks later than the average of April 1st. In 2017 the snow hit 0cm on March 29th, and 2016 was a really early melt on March 13th. So 2018 was pretty late, but 2011 and 2013 were later.

In 2018 the final spring snow was right after the melt, on April 23rd. That's a few days before the average of April 29, and about half of the time we will get some snow in May.

2018's first fall snow on September 12th was a week earlier than the 5-Year average of September 21st. Although that average had been really dragged-down recently by the early snows in 2014, 2016, 2017 & 2018. A decade ago the 5-year average for the first snow was more than a month later on October 27th, because for 2007-2011 the first snow waited until the last week of October or first week of November.

2018's first lasting snow on November 1st was about a week before the average of November 8th.

When we look at the averages the spring melt and final spring snow at the International are 1-2 weeks earlier than they were in the 1960s. But the first fall snow and lasting snow are actually a week earlier than they used to be.


Finally for today, here we are looking at the total length of the snowfree period each year at the International Airport. And again we have two definitions of "snowfree": from first melt to lasting snow; or completely snowfree from the very last snow on the ground in spring to the very first snow of autumn.

In 2018 the International went a total of 142 days (about four-and-a-half-months) completely snowfree, from April 23rd to September 12th.
  • 142 days made this the 18th shortest year (out of 57).
  • Since the 1960's the average has been around 160 days, although that's dropped a bit recently with 2014, 2016, 2017 & 2018 all being quite short.
  • The very shortest year was 1992 with only 90 days, from May 23rd to August 21st. Recently 2014 had 126 days and 2002 had 118. 
  • The very longest year was 1988 with 209 days from March 31st to October 26th. Recently 2011 had 197 days and 2008 had 190.

Completely snowfree days are a nice and precise measurement, but any year can get a bit of snow late in the spring or early in the fall without feeling particularly wintery. So I prefer the length between the big melt and lasting snow, where we are free of "permanent" snow.

In 2018 the International went a total of 194 days/6.5 months without "permanent" snow, from April 21st to November 1st.

  • 194 days made this the 7th shortest year.
  • Since the 1960's the average has stayed very steady at around 210 days/7 months.
  • The very shortest year was just a few years ago in 2013 with only 183 days, from April 27th to October 27th.
  • The very longest year was 1981 with 259 days, from March 25th to December 9th. Recently 2016 was 5th-longest with 247 days from March 13th to November 15th.


And that brings us to the end of the 3rd-and-final part of the giant Edmonton Weather Nerdery 2018 in Review.

If you are wondering what previous Precipitation years-in-review looked like:

2019/01/07

2018 in Review - Part 2 - Overall Precipitation

This is Part 2 of our 2018 Year-in-Review, and we will be looking back at last year's overall precipitation (rain + snow).
  • In Part 1 we looked at 2018's temperatures.
  • In Part 3 will we will focus on 2018's snow.
For temperatures we usually use the Blatchford weather station which is located near downtown Edmonton. If you are interested in how temperatures differ between Blatchford and the International Airport, that's covered here.

For precipitation the Blatchford station is missing a few years of recent data, and so for today we will mostly be using the data from the International Airport. If Blatchford's numbers are available then they will be included for comparison.


Precipitation History

We are going to start with this chart, which shows the precipitation (rain & snow) at the International for each year going back to 1995. It's impossible to read any numbers off of it, but it looks neat.

What is nice about this chart is that it shows just how much our precipitation ramps up during the May-August timeframe, and in comparison how low the winter months are. We will see that reflected in a lot of the other charts today, and this shows how consistent that is, year after year.

Now lets look at some numbers...


Monthly Precipitation

To get things started this chart shows the precipitation totals for each month of the year.

This chart uses a format that we will be seeing a few times today, with the recent average as a white line in the middle, and it is surrounded by a grey band for the 25th-75th percentiles (where things will fall roughly half of the time), and that is surrounded by the recent extremes in green and yellow (highest, second highest, second lowest, and lowest since 1995).

The blue line in this chart is the precipitation for 2018 at the International Airport, the green line is Blatchford, and the red line is the International's 2017 number for comparison.

In 2018 September was the International's most precipitation-y month at 79mm, and was just a touch below September 2006. June was 2nd and right around average, while July was in 3rd and just below the 25th percentile. That's a little strange, because July is typically our month with the most precipitation, with June in 2nd place. The last time that September was the month with the most precipitation was 2006 with 80mm. The last time that July wasn't 1st or 2nd was in 2008 when it was in 4th spot with only 36mm.

For Blatchford's numbers some of the months were a close match to the International, while others - like May & September - were much lower. Blatchford was above the International in January, April and July, but only by a tiny amount - July was Blatchford's biggest lead, but that was only by 3mm with 65mm vs 68mm.

And looking back to 2017, April was very high, and September was also quite high that year but not as high as 2018.


Days with Precipitation

This chart shows the number of days each month on which we had precipitation. The number of days with precipitation at the International in 2018 is in Blue, for Blatchford it is green, and the 2017 at the International it is red.

We just saw that September had a lot of precipitation, and it also had a lot of days with precipitation. At the International there were 18 days and at Blatchford it was 13, while the average for September is only 9 days. The International's 18 days were more than any September at the International, and they tied Blatchford's record of 18 days for September 1934 and 1996.

For the other months of the year April, May & June were all a little low coming in just a bit below the 25th percentile, and November was just a bit above the 75th percentile.

Looking back to 2017, April and November were both quite high, while December was very low.

Looking at the green line, Blatchford generally recorded 2, 3, 4 or even 5 fewer days with precipitation each month than the International did. That is one of the reasons that we are using the International's data as our baseline, because it is tough to know if the Blatchford data is actually reliable or not.


Cumulative Precipitation

Here we have all of the precipitation added up across the year for the International and Blatchford.

The International's 463.5mm was just a bit above average, while Blatchford was 105mm lower at 357.9mm. Following the blue and green lines in the chart a large gap opens up between them in May, and that grows bigger in September and November.

A similar gap between the stations happened in 2017 too, with the International recording 489.6mm while Blatchford was 114mm lower at 376mm. And that might be accurate...or it might reflect a problem with the Blatchford station.


Yearly Precipitation History

This is the yearly precipitation totals for the International, going back to 1961.

The International's 463.5mm for 2018 is down a bit from 489.6mm in 2017 and 496.3mm in 2016. It is still at the high-end of our recent range though, and above years like 2014 & 2015 which were down around 350mm.

Back in the 1960s through the 1990s totals in the 500-600mm range weren't uncommon, but since about 2000 our average precipitation has dropped a bit.


Here we are looking at precipitation totals each year, but this time we have Blatchford (1880-2007) and the International (1961-today). In this chart there is a green section which is shaded slightly darker for the years 1961-2007 when both stations had reliable data. That darker section is the difference between the two stations, and in some years Blatchford was higher, while in others it was the International. 

Blatchford's 2 years with the most precipitation were 1900 & 1901, and they were way up at 745mm and 699mm respectively. We have never seen anything else like that though, and Blatchford's #3-5 years are all in the range of 618-650mm, which is around where the International's top years are too.

Looking at the 5-Year average in red, from about 1900-2000 it was pretty consistently between 400-500mm. Since 2000 our average precipitation has dropped by about 50mm to the 350-450mm range, which we had originally looked at here. And before 1900 there were a bunch of low years, and that might be accurate, or that earliest data might have some problems. 

Earlier we saw that for both 2017 & 2018 Blatchford had recorded 100mm+ less precipitation than the International. Historically a large gap like that was not typically the case, with the two stations being fairly close to one another. So for Blatchford's low precipitation in 2017 & 2018:

  • possibly Blatchford just had two really low years in a row
  • possibly something has fundamentally changed at Blatchford
  • or possibly the data has problems
I do not know which it is, so we will continue using the International as our baseline, even though it would be really nice to have reliable precipitation for the city-proper.


Rain & Snow

And finally for today, here is how our precipitation is split between rain & snow each year.

We average around 400mm of total precipitation, and snow is just about one-third of that at 130cm (Environment Canada usually converts 1cm snow = 1mm precipitation). That split has stayed fairly consistent going back to around 1900.  And this year it was 464mm of precipitation with 167cm of snow...or about one-third.

We are going to leave things there for today, but we will have a whole bunch more charts dedicated to snow in Part 3 in a few days.

If you are wondering what previous Precipitation years-in-review looked like:

2019/01/02

2018 in Review - Part 1 - Temperatures

Today is Part 1 of the 2018 Edmonton Weather Nerdery Year-in-Review, and we will be looking at the year's temperatures.

  • In Part 2 will we will look at 2018's overall precipitation.
  • In Part 3 will we will focus on 2018's snow.

The charts today are all ones that have been used in the past, and since some of these can be complicated there will be links back to the original posts that have the full explanations.


High Temperatures

Here we have the High temperatures for the year.

The colourful stuff in the background of this chart is the range of temperatures that have been recorded at Environment Canada's Blatchford weather station since 1996. The average High for each day is the white line in the centre; it is surrounded by a grey band for the 25th-75th percentiles (where temperatures will fall roughly half of the time); and outside of that are the warmest temperatures since 1996 in orange and the coldest in blue. And finally, the all-time warmest and coldest temperatures going back to 1880 are shown as the faint lines that are furthest from the average.

In 2018 we set two records for warmest-since-1880 Highs: on August 9 & October 17. We also set three records for coldest-since-1880 Highs: on April 5, August 12 & September 13. Those new records are circled in red in the chart. Breaking records always sounds really impressive, but it usually happens a few times a year and we looked at that earlier in detail in How Often Does Edmonton Break Temperature Records? and in Record Watch: October 17, 2018.

In addition to the since-1880 records, the orange dots in this chart also show the days this year which were the warmest-since-1996. There were 22 more of those, mostly in May, June & July. And there were 18 more coldest-since-1996 Highs which are shown in blue, and a lot of those were in April & September.

The Red & Blue highlighting in this chart shows days that were above or below average. With that we can see the many swings from coldsnap-to-heatwave (or visa versa) that happened throughout the year. February, April & September were all really cold, while January, May, November & December were all quite warm. We will look at the months in more detail later on.


Low Temperatures

And here we have the Low temperatures for 2018.

We set three records for warmest-since-1880 Lows: on May 8, May 24 & June 25. There were also 15 more warmest-since-1996 Lows, again mostly in May, June & July.

We didn't set any coldest-since-1880 Lows, but those don't happen very often. We did have 22 coldest-since-1996 Lows spread throughout the year, and a lot of those were in April & September.


Warm & Cold Months

In this chart we break things down further, and we can see how much warmer/colder each month of the year was compared to the 20th century average. And the recent 5-Year average is also shown as the grey, dotted line. The full explanation of this chart was in How Warm is 2017 - the Months.

For 2018 we had 5 months which were colder than the 20th century average for that month: February, March, April, September and October. And there were 7 months which were warmer: January, May, June, July, August, November and December.

Notably:

We have just finished a December which was relatively pleasant at 4°C warmer than the 20th century average, but that was only enough to rank as 33rd warmest. January was also 4.2°C above the 20th century average, which put it as 37th warmest. And February was the 47th coldest at about -2°C below the 20th century average, but it was well below the recent average and was 4-6°C colder than most of the recent Februarys in the chart.

Our cold April and hot May meant that 2018 jumped straight from winter into summer. And then the very cold September put an abrupt end to summer, plunging us into what felt like the middle of fall.


Here's another look at how warm & cold months have been distributed throughout the last 20 years.

Almost every year here had more warm months than cold ones. 2002 is the only year with a 6-6 warm/cold split. This year we had 7-5 warm/cold, which also happened in 2000, 2004, 2009 & 2013. Last year in 2017 there were only 3 months colder than the 20th century average, 2016 had 2, and 2015 was a big El Niño year with all months warmer than the 20th century average.

Right now this chart is mostly full of orange bubbles, but that has changed over the years:


This chart shows how warm & cold months have been distributed since 1880. The "20-Year Average Difference" on the right shows the average temperature for each month has changed over time. We took a detailed look at that in The Months through the Years.


The Horserace

We've looked at the days and at the months, but how does 2018 compare to other recent years?

For a full explanation of this chart it's easiest to refer back to the original discussion of it in How warm is 2016? (September Edition). Generally though, it tracks how much warmer each day of the year was compared to the 20th century average - warm days get points and cold days lose them. The blue and orange background is the range of all the years going back to 1880, and they are grouped together like that because showing each individual year gets too messy. To keep things simple the last 10 years are shown here as a reference.

Every year follows a different path, and 2018 started off promisingly enough with a warm~ish January. But then it dropped during the cold February. Then it really dropped during April, and was down below the 20th century average for a bit. But then the really warm May and June pushed it back to the positive side. Then the cold, early fall pushed it down again in September and October. And to end off the year it climbed up again pretty steadily during the relatively mild November and December.

And with that 2018 ends up as Edmonton's 34th warmest year since 1880, which is a bit on the cooler-side of recent years. It's nowhere near the really warm El Niño years like #3 2016 and #4 2015. It's also not as cold as the cooler years like #71 2009 and #47 2014. But of the "typical" recent years - from #16 2017 down to #40 2013 - 2018 was closer to the low end. It was also essentially tied with #36 2011, averaging just 0.003°C warmer across the whole year.


Warmest and Coldest Years

This chart lets us compare all of Edmonton's warmest & coldest years, going back to 1880.

The explanation for this chart is in Edmonton's Warmest Years, but it essentially averages all the temperatures for an entire year, and then compares that to the average for the 20th century. The National Oceanic and Atmospheric Administration use the 20th century average as their baseline, and that is why we are using it here.

2018 is the 34th warmest, at 0.8°C warmer than the 20th century average. That's down from 2017 which was 1.6°C warmer, and way down from the El Niño years 2015 & 2016 which were up at 2.5°C and 2.9°C respectively.

This chart also shows the 5-year average, which really shot up in the mid-1970s and has stayed high ever since. Right now that 5-year average is at 1.7°C above the 20th century average, and that is the highest that it has ever been, even though 2018 was a bit cool~ish. That 1.7°C just edges-out the previous high of 1.65°C from 1990.


Calgary, Winnipeg & Montréal

For a bit more context, here we have the warmest & coldest years for Calgary, Winnipeg & Montréal. How was 2018 in those cities?

  • in Calgary it was cool~ish, coming in as 40th warmest and 0.5°C above the 20th century average.
  • in Winnipeg it was cold, as 57th warmest and only 0.1°C warmer than the 20th century.
  • in Montréal it was warm, as 18th warmest and 1°C warmer than the 20th century.

Right now Edmonton's 5-year average temperature is at 1.7°C above the 20th century average. For Calgary it's at about 1.4°C, for Winnipeg it's only at about 0.7°C, and for Montréal it's at about 1.1°C. Since 2000 Edmonton, Calgary and Montréal haven't had any below-average years, but Winnipeg has had 5, and that's why its average is relatively low.

Here are the individual charts if you want to take a closer look:


If we watch the 5-year averages we can see that all of the cities follow a similar pattern, with lots of cold years a century ago, and lots of warm years since the mid-1980s. We also see that certain years - 1931, 1981, 1987, 2016 - were warm at several stations, while a year like 1996 was cold for all of the weather stations.

Whenever we use the data for these other cities I ike to warn that what we're looking at is not necessarily 100% equivalent: the Blatchford weather station for Edmonton is downtown~ish; Calgary's is on the edge of the city; Winnipeg's is on the edge of the city~ish; and Montréal's is the furthest from downtown, but it is surrounded by city, and it is near the St. Lawrence. And so this isn't going to be a true apples-to-apples comparison, but it is what we have available.


Outlying Areas

You might think "Edmonton, Calgary, Winnipeg and Montréal are all big cities, so of course they've warmed up." And that is an excellent point, and so this chart tries to do the same comparison with the data that is available for 3 rural stations which are near Edmonton: Calmar, Campsie & Sion. We have used these stations before in:

These stations all have roughly a century of continuous data, so they are good for making comparisons. Unfortunately they aren't perfect, because the measurements didn't start until the mid-1910's and they all ended in the mid-2000s. So this chart has the warmest & coldest years for those stations based on the limited data available.

One of the slides of this animation also combines data from the Calmar station (1916-1960) with the Edmonton International Airport (1961-2018) to try to get a longer-term comparison. The two stations are located fairly close to one another at about 15km apart, but the International averages about 0.6°C colder than Calmar. 0.6°C doesn't sound like a lot, but it's enough to noticeably shift the warm/cold years in this chart. So the Calmar & EIA slide is included here as an experiment, but it doesn't actually work very well.

With this admittedly imperfect chart we see a similar pattern to what we saw for Edmonton, Calgary, Winnipeg and Montréal, with lots of cold years a century ago and lots of warm years from the mid-1980s onwards. And when the measurements for these stations stopped in the mid-2000s all 3 of them were averaging 1~1.5°C warmer than their 20th century averages.

And so this definitely is not a perfect comparison. But the rural stations have seen similar increases to what we have seen in the big cities, and so the cities are not warming up just because they are cities.


Really Cold Days

Switching back to the data for Edmonton alone again, here we are looking at the really cold days each winter. In 2018 Blatchford had:
  • 24 days with Low temperatures of -20°C or below
  • 5 days at -25°C or below
  • 1 day at -30°C or below (that was February 4th at -30.7°C)

Since 1880 the number of cold days each year has been in a fairly steady decline, although the numbers bounce around on a year-to-year basis. 2015 & 2016 were both El Niño years and had very few cold days. But just before that 2008-2014 had quite a few years with a lot of cold days.

2018's results were right around the average.


Really Hot Days

Right now summer feels like it was a long time ago, but we really did have a hot (though short) one this year.

We had 55 days which hit 25°C. That was the 5th highest since 1880, after 1922 with 57, 1894 with 59, 1961 with 60, and 1898 in top spot with 64. And this year we had a ridiculously cold September and a cold end to August, so all of those hot days fit into May through mid-August.

In recent years 2017 was in 9th place with 50 25°C days, and 2015 was 6th with 52. But even about 5 years ago things were way down, with 21 days in 2011, 20 in 2010 and 19 in 2005. Since 1880 there has obviously been a lot of year-to-year variability, but the 5-year average has mostly been between about 30 and 40 days. Recently though 2014-2018 have all been above 40 days, and so our 5-Year average is 47.6 25°C days.

For really hot days 2018 was also on the high side of things, with 19 days hitting 28°C, 7 at 30°C and 2 at 32°C. Historically there's been a lot of variability in those days as well, and the last 5 years were fairly hot, but not exceptional. We looked at all of that in a more detail in Edmonton's Warmest & Coldest Summers.

And that's it for the 2018 in Review - Part 1 - Temperatures. Later in the week we'll be back with Part 2 - Precipitation.

And if you are wondering what previous years-in-review looked like:

2017/09/12

How Often Does Edmonton Break Temperature Records?

Today we're going to look at how often temperature records are broken in Edmonton.

This week we set a new all-time High on September 11th at 29°C. Last week we set another one on September 7th at 32.2°C, and earlier this year we broke other records on May 5th at 28.9°C, and on February 15th at a scorching (for February) 16.4°C. Four all-time records in one year might sound like a lot, but in 2016 there were 7, and in 2015 there were 5.

One caveat today is that Edmonton has had 3 different weather stations since 1880, and the data varies a bit between them. We looked at the stations here, and saw that the current station often measures temperatures about 0.5°C colder than the previous station did. Normally that's not a big deal, but when we're talking about breaking records even 0.1°C can make all the difference.

So the thing to keep in mind today is that this is more for the sake of trivia than for any great insight.  There is a lot of chance involved in breaking a record, because it's often just a matter of being at the right place at the right time.

Now lets look at some charts:

High Temperature Records Broken Each Year

This chart shows each day of the year along the bottom, and along the side is the year when a new High temperature record is set. When an old record is broken it fades into the background as a grey dot.

Environment Canada's temperature records start in 1880, and during the first few years basically every day was a new record. By the time we reached 1900 things had settled down to about 20 records per year, and from the 1950s onwards the average has been about 4 per year. As we move further along it theoretically gets harder to set new records, because there's more data to compete with.

Recent (2000-2017) High Temperature Records

Here's a closer look at the records which have been broken since 2000.

In 2000 and 2010 we broke 0 records, while 2002 and 2016 both broke 7. It's pretty typical to break 3 or 4 records per year, and so far in 2017 we've broken 4.

Long-Standing High Temperature Records

The earlier charts showed how often records are broken, but this one shows the records that are still standing, and how long ago they were set.

Edmonton has one unbroken High temperature record which goes all the way back to December 12 1880, with a High of 10.6°C. And of the 366 days of the year, 45 of these records were set prior to 1900. Most decades claim about 25 records, but the 1930s hold 49. The 2010s aren't over yet, but so far we're at 24.

Years with Most High Temperature Records

And finally, here are the the years which hold the most High temperature records.

1889 and 1934 have the most records right now, with 10 each. 1910 has 9, 1981 has 8, and then 1936, 1939, 2002 and 2016 all have 7.

So that covers the warmest-High temperature records. Next we're going to flip things around to look at the coldest-Lows.

Low Temperature Records Broken Each Year

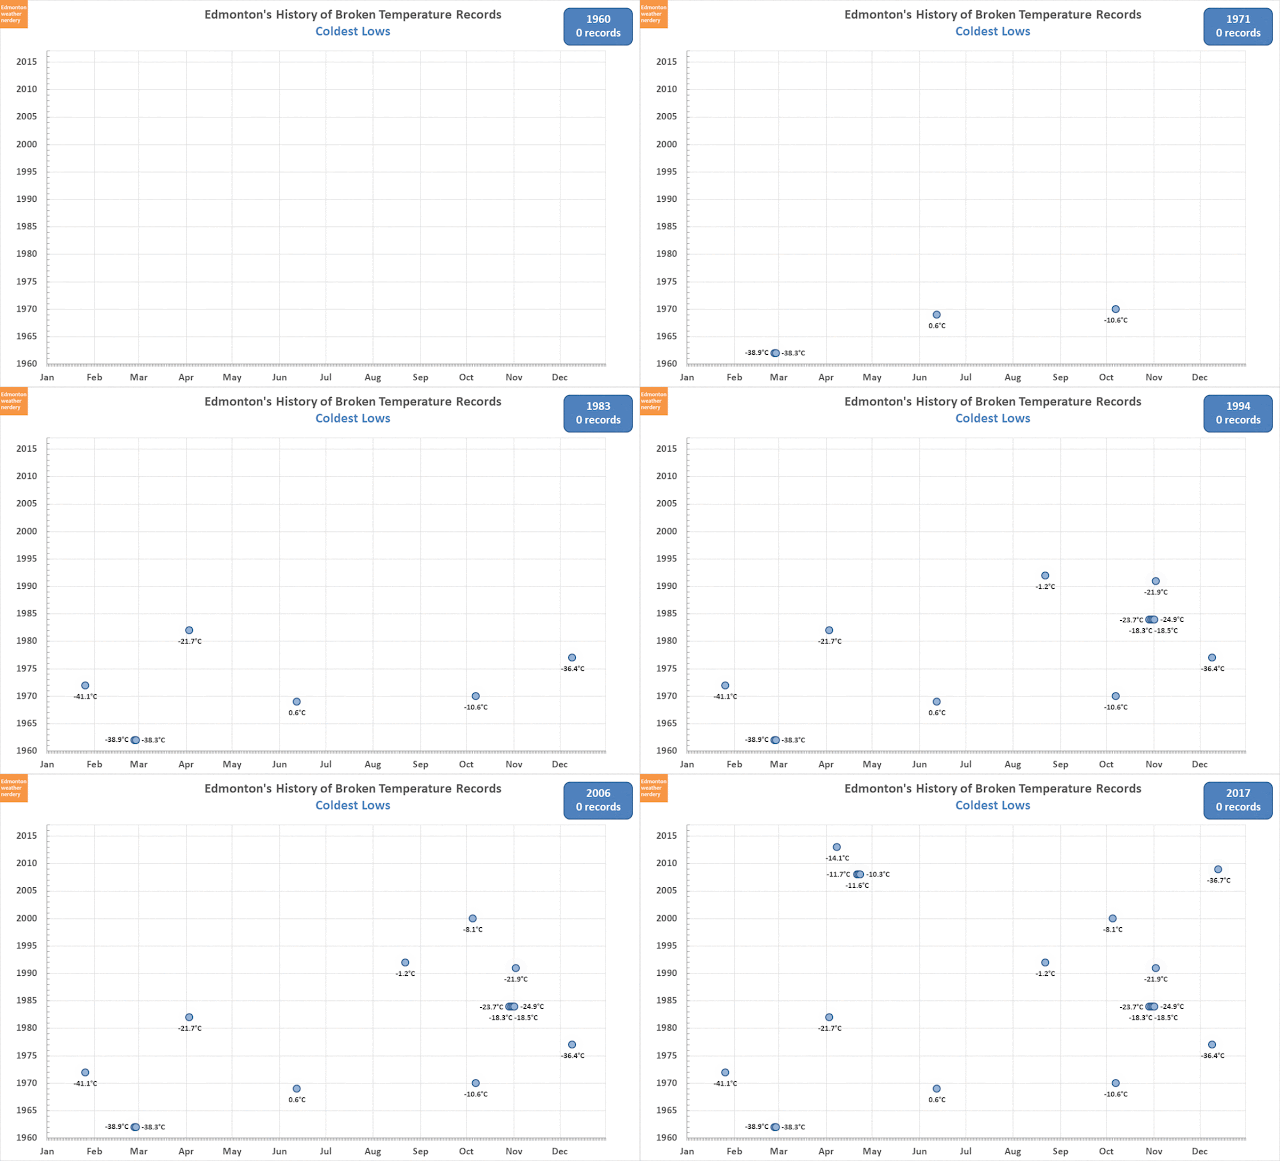
Here we have the history of broken records for coldest Low temperatures. It looks quite a bit different from what we saw for the warmest Highs, because after about 1960 the broken records get pretty sparse.

"Recent" (1960-2017) Low Temperature Records

This chart shows all of the Low temperature records which have been broken since 1960, and there are only 19 of them.

Probably the most notable record here was -36.7°C on December 13, 2009, because on that day the Edmonton International also recorded a temperature of -46°C. And that inspired a number of "coldest place in Canada" headlines, and it continues to inspire a number of "Edmonton's winter is 8 months of solid -75°C!" anecdotes.

Long-Standing Low Temperature Records

If we breakdown our Low temperature records by decade, more than 90% of them were set before 1950, and one quarter of them were set in the 1880s. So far in the 2010s we've only set the one, on April 8 2013 at -14.1°C.

There are two other types of temperature records that we haven't looked at yet: coldest-High and warmest-Low. For the sake of completeness we'll take a quick look at those too.

Coldest High Temperature Records

We just saw that we don't break records for coldest-Low very often anymore, but coldest-Highs are a bit more common.

In the last few years we've set records for coldest-Lows on September 8 2014 at 3.8°C, April 30 2013 at -0.2°C, July 22 2011 at 12.6°C, and May 22 2010 at 6°C. None of those were during the winter though, so they might not seem too extreme.

Probably the most notable recent record was December 13 2009, with a daytime High of -28.3°C. That's the same day that had the record-setting Low of -36.7°C, which we had looked at earlier.

Warmest Low Temperature Record

And finally, here is how the records are spread out for our warmest-Lows. Earlier we saw that for the warmest-Highs we break about 3-4 records each year, and for the Lows it's a little bit more frequent sitting in the 4-6 per year range. So far in the 2010s we've set 41 warmest-Lows, compared to 24 warmest-Highs.

The most notable thing about these records is probably the giant gap highlighted below:


For June through October, almost all of the temperature records for warmest-Low were set after 1950. The other records we've looked at today were spread out fairly evenly, going back to the 1880s. But for the warmest-Lows during the summer months there are only about 8 remaining records which were set prior to 1950.

One final piece of trivia is that the current record warmest-Low for July 22 was set in 1880, at 20.6°C. The records in Edmonton started on July 11, 1880, and so that one was set in week #2, and it hasn't been broken since.

That's it for today's look at temperature records. When we break a record it always seems momentous, but it actually usually happens a handful of times each year.

2017/02/06

Snowstorms

I've had this one written for awhile, but I like to be topical and was really hoping to post it during a snowfall warning or a nice, 3-day snowstorm. But since October we haven't had much in the way of snowpocalypses.

We might get a bit of snow today, but southern Alberta is getting a true snowpocalypse right now. And that's as good an excuse as any to talk about snowstorms. This is Part 5 of my recent(ish) look at Edmonton snowfall:

The first question is: when it snows, how much does Edmonton typically get? 1cm? 10cm? More?

Typical Snowfall Amounts

This shows the breakdown of how much snow we get in a typical day's snowfall. I'm including data from Blatchford and the International here, because Blatchford data goes all the way back to 1880 but stops in 2007, and the International data is current but it only goes back to 1961.

For both Blatchford and the International, almost half of the time snowfall will be less than 1cm. About 85% of the time it will be less than 5cm, and 95% of the time less than 10cm. And days above 30cm are very rare.

Looking at daily snowfall is a bit problematic though, because snow will often start in the evening and continue on through the morning. Environment Canada's numbers would split that across the two days, but I'd rather look at that as a total. So for the rest of today I'm going to look at snowfall "Events" and try to combine the totals when there were several days in a row with snowfall.

I'm going to define a Snowfall Event as:

  • the total snow on consecutive days where each day received at least an inch of snow. 

I've put that 1" cutoff in there, because I don't want to combine a bunch of days which only received a light dusting. 1" is completely arbitrary, but using 1cm as the cutoff seemed too low, and setting it at 2.5cm moves things beyond the 0-2cm range which makes up about 65% of snowfalls.

So with all of that said, here is the chart revised for these multi-day snowfall Events:

Typical Multi-day Snowfall Events

It doesn't look much different, but things have shifted around a bit. In particular, for snowfall of 10cm or more we're now seeing slightly higher numbers. What's happening is that some of the 2-5cm and 5-10cm days are now combined to give larger multi-day totals.

For a little bit more explanation of what grouping snow into these Events actually does:

Here we have hypothetical examples of two different 3-day sequences - in both cases the total snow for the 3 days is 20cm.

Example 1 is counted as 3 small snowfalls, because the second day only received 1cm of snow, which is below the 2.5cm cutoff.

Example 2 is grouped together as one big event, because all three days cross the 2.5cm threshold.


This is just an approximation that I've made up, and it's certainly not perfect or scientific. But for trying to count snowstorms I think it makes sense to group snowfall into a multi-day total like this, rather than just looking at the 24-hour amounts.

So what qualifies as a lot of snow? Personally, I think 10cm is a nice starting point. With 10cm of fresh snow on the ground walking and biking gets challenging, and I'm sure that the Quesnell bridge will be a mess.

More than 10cm (4") of Snow

Here we have the count of snowfall events for each year that are greater than 10cm.

I haven't included 2016-2017 in any of the charts today because the winter isn't over yet. But for the record, back in October the International got 11.5cm from the 7th through the 9th, and then 9.5cm on the 14th. And those are the only really notable storms so far.

This also isn't perfect, because it shows 2015-2016 with no 10cm events, while I'm pretty sure that the downtown had one major snowstorm. For November 23 & 24, 2015 the International recorded 9.4cm of snowfall, but Environment Canada also has a station at the UofA which recorded 15cm. I think that's a better representation of what actually hit the city, but I'm not going make things even more complicated by mixing in the data from a 3rd station. For today we'll just have to accept a bit of imprecision.

Generally, we can see that in most winters there are from 2-to-5 10cm snowfall events. Some winters have 6-or-7, and some have 0-or-1, but 2-to-5 is pretty typical. And outside of a few really snowy years (1903-1904 and 1906-1907) that hasn't changed much in the last century.

When are these 10cm+ snowfalls most likely to happen?


Of the roughly 2-to-5 snowfalls greater than 10cm in a typical winter, here is the likelihood of them occurring in each month.

If I had been forced to guess, I would have said that November gets a disproportionate number of big snowfalls. Looking at the numbers though, things are spread fairly evenly. Of the real winter months January is the highest and February is the lowest, but none are really a huge standout.

For a little bit more context, for the rest of today we're going to include Montreal as a comparison.


Here we have the same count of yearly 10cm snowfall events, but with Montreal added on top in purple. Central Canada and the northeastern US gets much larger yearly snowfall totals than we do, and I wanted to see how things compare.

Where Edmonton typically gets 10cm snowfalls 2-to-5 times per winter, Montreal is more in the range of 4-to-7. And their historic extremes are between 15 and 18 times per year.

(if it looks like Montreal's numbers are trending downward, that is correct. Montreal's overall snowfall has fallen by about 50% over the last century. But that is a story for another time...)

For a little bit more detail, here we'll look at recent history:


This is the same chart as above, but now only going back to 1980. (Montreal's data ends in 2013, so the last few years might look low on this chart, but that is because they are actually missing).

Hopefully this makes it a bit easier to see what is going on. Blatchford and the International are pretty similar, although it looks like Blatchford typically got a few more snowy days (before the data ended in 2007). And Montreal generally gets about twice as many 10cm snowfalls as the Edmonton stations (before that data ended).

10cm is pretty snowy, but it's not really snowy. Next we'll look at snowfall events of more than 20cm.

More than 20cm (8") of Snow

Here is the same basic chart, but now we're looking at snowfall events of 20cm or greater.

The numbers have dropped off, with Edmonton now typically in the range of 0 or 1 events each year. And going back a century it hasn't changed much - the average has fluctuated around a 60% probability each year since the records started. Montreal is much higher, frequently seeing 3 or more 20cm snowfalls, although there are a few years that have only seen 1.

Now we'll focus on recent history again:


Here we have a closer look at the 20cm snowfalls.

The standout is 1992-1993 with 3 20cm snowfalls at Blatchford, but that whole 1990-1994 period had at least one 20cm event each year. More typically though they happen about every-other-year. And just in the last 10 years Edmonton's numbers have dropped, so that we've only seen a 20cm snowfall every 3 or 4 years.

Montreal's numbers bounce around quite a bit, but they've almost always had at least 1 20cm snowfall, and 2007 had 7. And then from 2013-2014 there are no records.

Finally we'll up the numbers one more time and take a look at 30cm snowfalls.

More than 30cm (1') of Snow

At least according to Environment Canada's measurements, 30cm snowfalls are very rare in Edmonton - there have only been about 20 of them recorded going back to the 1880s. There was a period in the 1940s where they happened almost every-other-year, and there were two in the winter of 1984-1985, but other than that things have been much more spread out.

The most recent was 35.2cm on May 5th & 6th 2003, and before that 40.6cm on April 6th & 7th 1991.

Montreal also doesn't typically get a huge number of 30cm snowfalls, but they are more frequent and occur roughly every-other-year. And 2007-2008 was a really snow year, with 3 of them.

I chose to include Montreal in these charts today for a few reasons:
  1. I was curious how central Canada compares to Alberta.

  2. Adding Montreal actually makes the 20cm and 30cm charts easier to interpret - they don't look very good with Edmonton data alone since it just bounces between 0 and 1. 

  3. Having a second city gives a bit more context. I know that the absolute numbers today - 10cm, 20cm, 30cm - are a little questionable. As I said, last November there was one day downtown that definitely had more than 10cm, but Environment Canada didn't record it that way at the airport. And in the last 5 years the media have reported 30cm at least a few times, but again those don't show up here. With Montreal here as a comparison, we can see that whichever exact "10cm" or "20cm" we're talking about, Montreal obviously has more of those than Edmonton.
For that last point then, lets go back to the beginning and look at the breakdown of typical snowfalls - but this time with Montreal added to the mix:

Typical Snowfall Events redux

And here we can see that Montreal's distribution is a little different than Edmonton's.

In particular, about 7% of their snowfalls are 20cm or more, compared to 1-2% of the time for Edmonton. And 18% of their snowfalls will be 10cm or more, compared to about 8% for Edmonton. Montreal has a shorter snow-season than Edmonton does (which we saw here), but when they get snow they are more likely to get more of it.

Finally for today, just for the sake of trivia lets look at the biggest snowfall events for Edmonton and Montreal:

Largest Snowfall Events

There's a lot of information here, but this is basically a scatterplot of the largest recorded snowfalls for Edmonton and Montreal. It shows the Top-5 largest snowfalls for each city, and I've broken things down into the modern era from 2000-onwards, as well as the Top-5 ever recorded.

Because of the way that I've grouped snowfall into events, some of these totals were just one snowy day, some were 2 or 3, and there's one which is most of a week. 25cm spread over January 17-22 is maybe stretching the idea of a "snowfall event" a little bit, but the rest are okay. And I'm still happier using these multi-day groupings rather than individual 24-hour periods.

Historically, Montreal's 5 largest multi-day snowfalls were in the range of 57cm to 68cm. But since 2000 the largest was 50cm in 2000, with the rest between 36cm and 46cm.

Edmonton largest historic snowfalls are between 42cm and 47cm. And the recent Top-5 ranges from 21cm up to 35cm in 2003.

Ultimately though, what all of this means for giant snowfalls in Edmonton is:
  • 10cm (4"): usually about 2-5 times per year
  • 20cm (8"): maybe every-other-year
  • 30cm (1'): none in the last decade, 3 in the last 30 years.
And as I said earlier, for the winter of 2016-2017 the two big snowfalls were back in October: 11.5cm on the 7th through the 9th, and then 9.5cm on the 14th.