Showing posts with label Tableau Public. Show all posts

2019/08/11

ABC's of Air Quality

Today we are going to talk about Air Quality.

We will start with a caveat: I am not an expert on this. If any experts read this they will think "This person is not an expert" and they will be correct, because I am not an expert.

But at the end of May 2019 Edmonton had a very, very, very, very, very, very, bad day for Air Quality.


During that very bad day Environment Canada and the media were focused on real-time reporting, because the public needed to be warned about the health risks. But hearing things like "On a scale of 1 to 10 this is a 9...now it's 12...now it's 25...now it's 72" left me with a lot of questions.
  • How often does it happen?
  • How often does it happen in May?
  • How does it compare to August 2018?
  • How bad is it?
  • Has it ever been this bad before?

I was unable to easily find answers to those questions, and so this is the Edmonton Weather Nerdery attempt at providing some context. All of the data today is from the province of Alberta, with the realtime data available at http://airquality.alberta.ca/map/ and the historic data from http://airdata.alberta.ca/.

Normally on this blog we talk about things which are pretty straightforward and objective like temperature: 0°C = 32°F = 273.15K. Air quality measurements are a bit different because they are an attempt to quantify the health effects that poor air has on people. Today we will be looking at two different scales - AQHI and AQI - and those numbers won't be a perfect match, and that is okay.

Let's jump right in with a dashboard that has a lot of things going on:
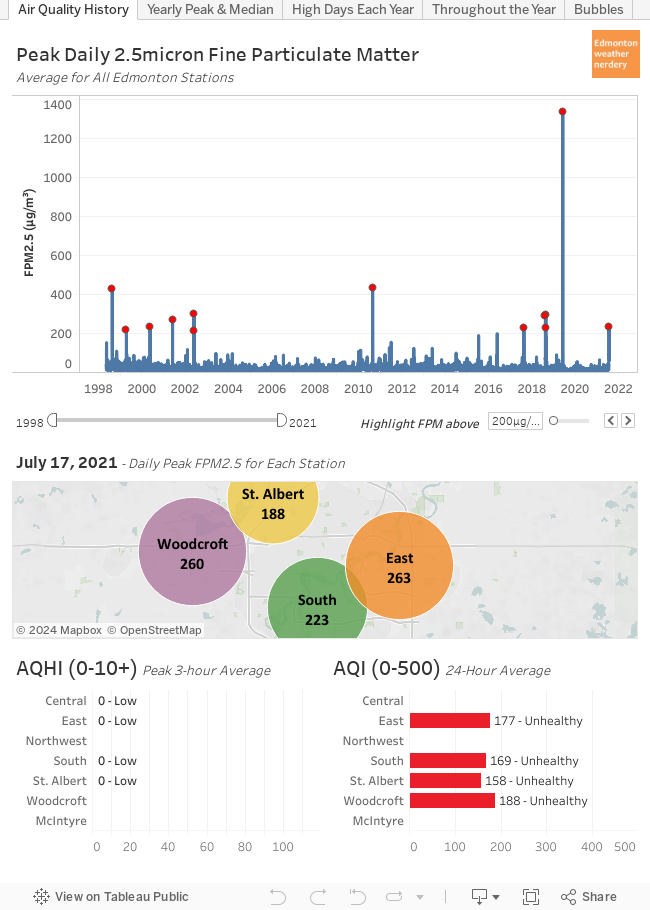


This dashboard is interactive, and as you hover your mouse over it (sorry, mobile users!) the data will update for different days going back to 1998.

Some Background

Stations:
  • Edmonton has 7 stations recording hourly air quality.
    • The Northwest station has data for 1998-2004; Central & East began in 2001; and the other stations began after that.
    • Some stations only record FPM2.5 (which we will explain in a second) while others also record Ozone and Nitrogen Dioxide.
  • The map in the middle of the dashboard shows the highest hourly FPM2.5 for each station on a given day.

FPM2.5:
  • FPM2.5 is the measurement of the mass of Fine Particulate Matter (2.5 micron) in the air in µg/m³. When the air is smokey that level of FPM2.5 goes up.
  • The chart at the top of the dashboard shows the peak daily FPM2.5 averaged for all stations.
  • The red dots highlight days with a peak FPM2.5 averaged for all stations of more than 200µg/m³. Typically we are around 20µg/m³, and so the red dots are 11 of the very worst days for Air Quality in the Edmonton region in the past 2 decades.

AQHI:
  • The Air Quality Health Index (AHQI) was created by Environment Canada and is only used in Canada. 
  • It is calculated from the levels of FPM2.5, Ozone & Nitrogen Dioxide. (Alberta uses a slightly modified version of the AQHI but to track other compounds, but to keep things simple we will be sticking with the Environment Canada Standard)
  • At the bottom left of the dashboard is the highest 3-hour average AQHI for each station on a given day.
  • AQHI has a scale of 1-10+.
  • From Wikipedia:


AQI:
  • The Air Quality Index (AQI) is at the bottom right of the dashboard. 
  • AQI is used internationally.
  • Separate AQIs can be calculated for individual compounds (Ozone, Nitrogen Dioxide, Sulfur Dioxide...) but we will only be using the level of FPM2.5.
  • At the bottom right of the dashboard is the 24-hour average AQI for each station on a given day.
  • AQI has a scale of 1-500.
  • From Wikipedia:

One thing to point out is that all of these are measured hourly, but AQHI is calculated as a rolling 3-Hour average, while AQI is a daily average. So in the charts today we will have a mix of peak daily FPM2.5 (because I think the peak is interesting), peak 3-hour average AQHI, and 24-hour average AQI.

With that background out of the way, lets take another look at the data:

May 30, 2019
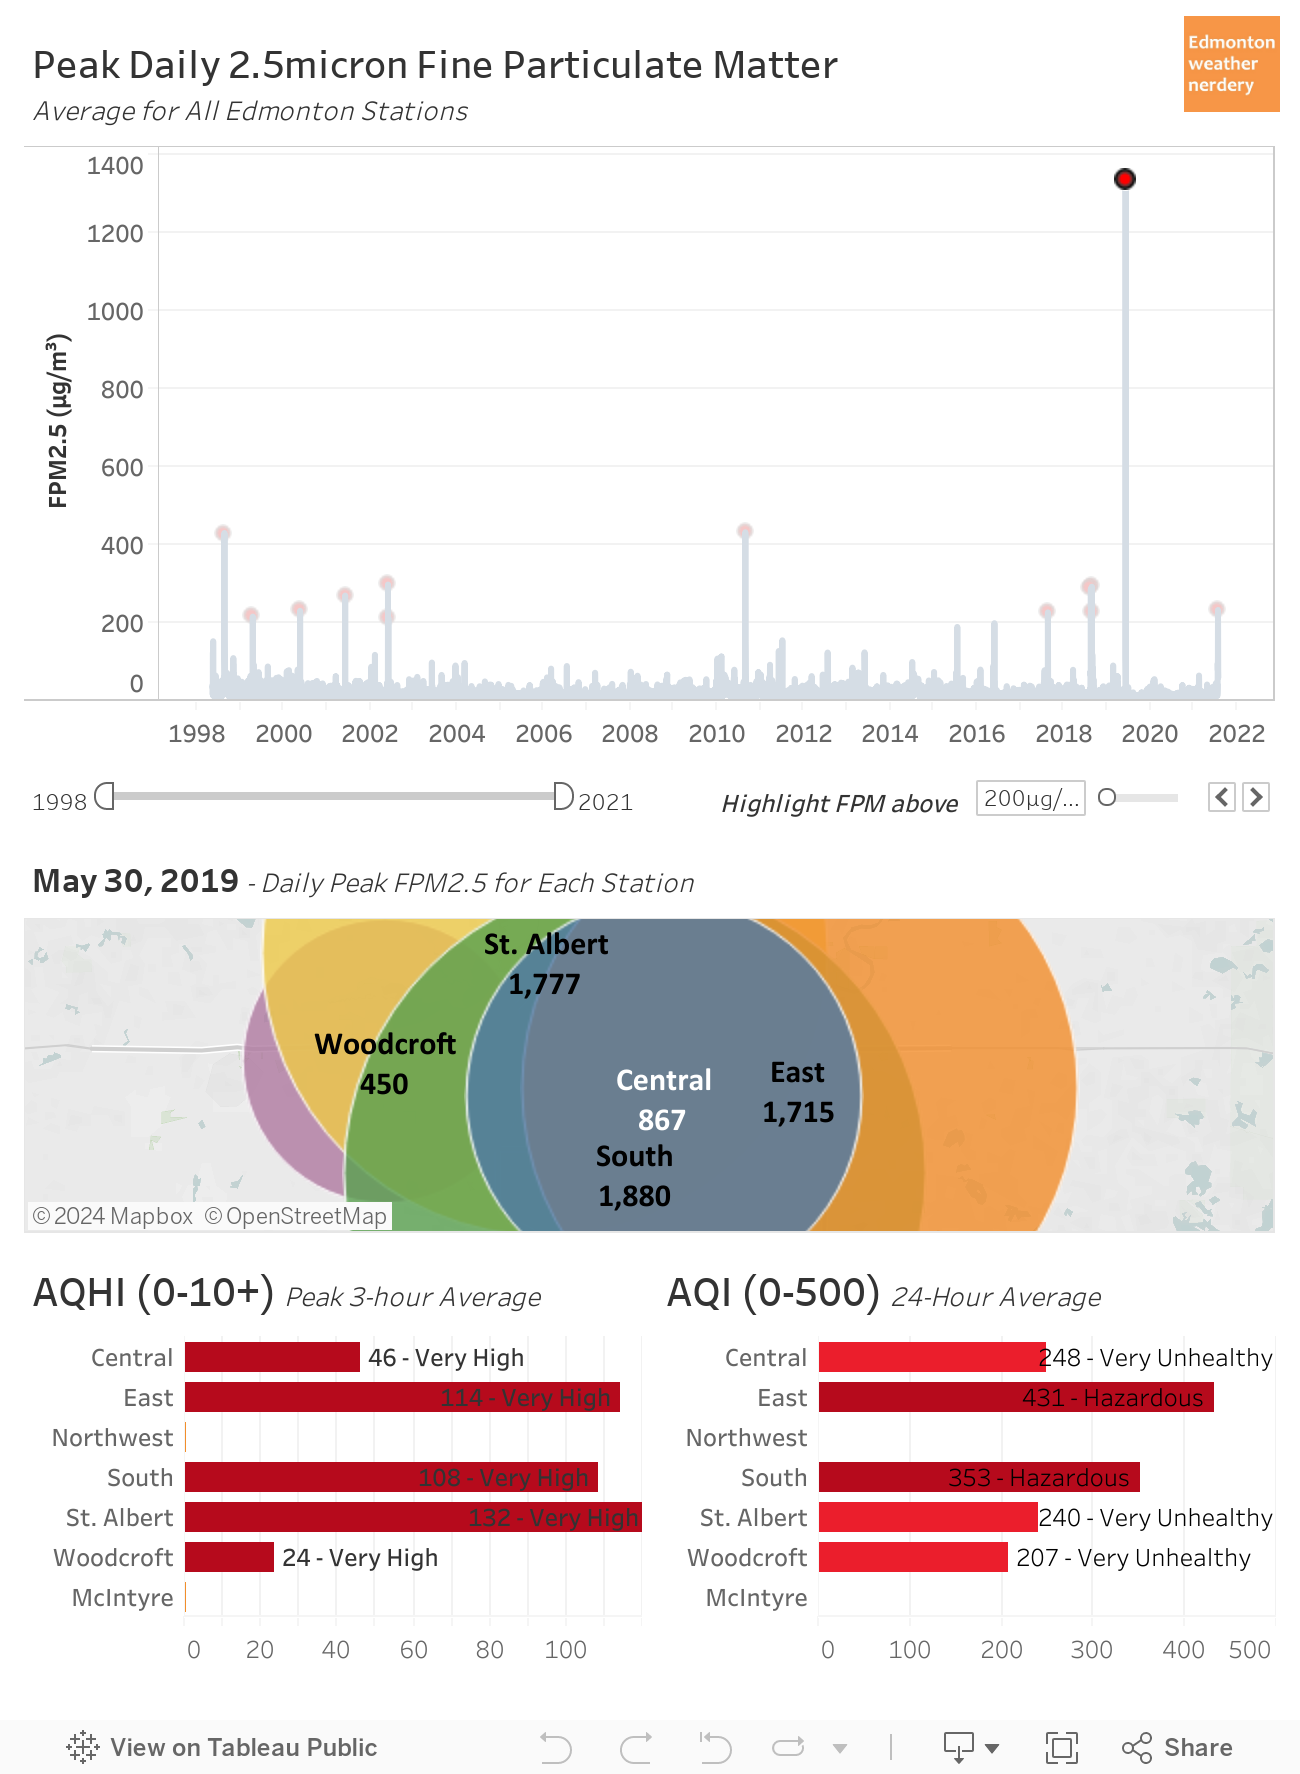


So how bad was the air quality on May 30, 2019? Unfortunately we don't have a lot of history to compare it to because the data only goes back to 1998, but based on what we do have May 30, 2019 was off the charts.

  • The average of the peak FPM2.5 for all of the stations was 1,338µg/m³. Since 1998 the previous record had been August 19, 2010 way down at 433µg/m³.

  • The peaks for the individual stations ranged from Woodcroft at 450µg/m³; to Central at 867µg/m³; to East & St. Albert above 1,700µg/m³; and South was at 1,880µg/m³. The previous highest measurement at any station had been 450µg/m³ at the Central station on August 19, 2010.

  • The highest 3-Hour average AQHI (on a scale of 1-10+) ranged from Woodcroft at 24, Central at 46, South at 108, East at 114, and St. Albert at 132. The previous highest AQHI since 1998 had been 23 on August 19, 2010 again.

  • The AQI for the day (on a scale of 0-500) ranged from Woodcroft at 207 (Very Unhealthy) to East at 431 (Hazardous). The previous highest AQI since 1998 had been 222, also on August 19, 2010.

At the time it seemed like May 30, 2019 was extra-bad, and the data backs that up:
  • a typical day is around 20µg/m³.
  • a really, really bad day (10 in the past 20 years) hits 200µg/m³.
  • the previous worst-of-the-worst days (2 in the past 20 years) hit 400µg/m³.
  • and May 30, 2019 blew them all away with readings of 850, 1,400, 1,880, etc.

A Brief History
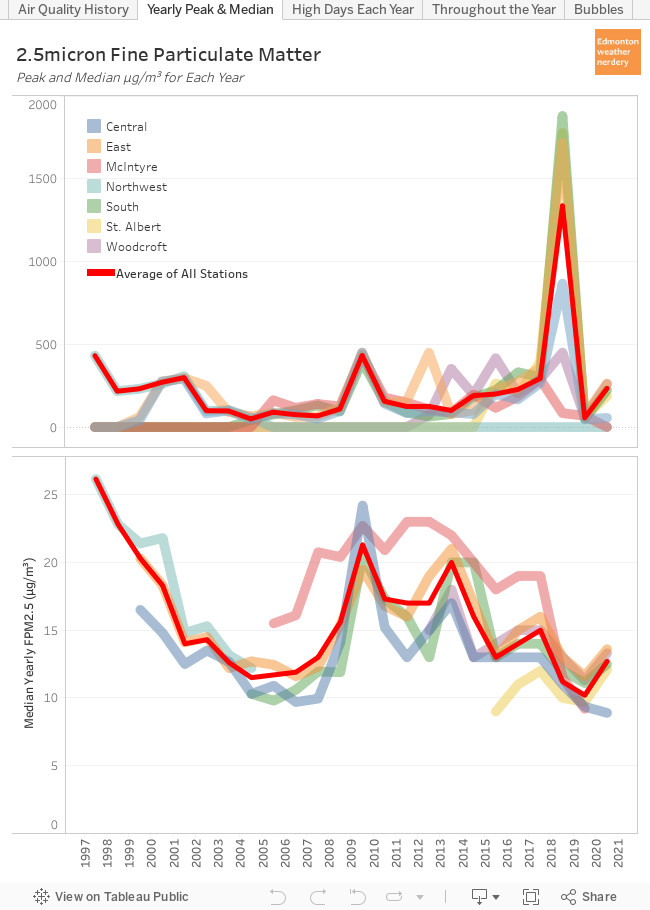


This dashboard shows the highest FPM2.5 and the median FPM2.5 for each year for all of the stations. With this we can see how things have changed on a yearly basis.

A few cautions about this:
  • This uses the yearly median FPM2.5 because the yearly mean (what we typically think of as an average) is too susceptible to extreme values. If we have 1 day at 1,880µg/m³ that is the equivalent of 90 "typical" days, and it drags the yearly mean way, way up. The yearly median is a better representation of a "typical" day throughout the year.
  • The red line is the average of all the stations, but this is affected by which stations have available data:
    • For 1998-1999 only the Northwest has data available, and its yearly mean tends to be higher than the other stations. So the "Average of All Stations" looks really high for 1998-1999, but that's because it is just the one station. 
    • For 2006-2019 the McIntyre station starts reporting, and its yearly mean also tends to be higher than the other stations, and so that also drags the overall average up.

20 years isn't really enough time to identify long-term trends, but with what we have available we can see:
  • A low yearly peak is around 100-150µg/m³, but 2002, 2010, 2013, 2014 & 2016-2019 all had at least one station with a peak of 300µg/m³. There have been more high-peaks in recent years, but that might just be because there are more stations reporting.
  • For the yearly median most stations are between 12-20µg/m³. But for both Northwest and McIntyre the median is often 5µg/m³ more than the other stations.
  • 2010 is a standout year, with all of the stations having a peak between 400-450µg/m³, and the yearly mean for all of the stations was also higher than normal, ranging from 20-25µg/m³.
Alberta's policy guidelines for particulate matter are here.

The 24-hour average target is 29µg/m³, and today we're mostly focusing on peak-numbers so we will maybe take a look at that at some point in the future. But for peak-numbers, Alberta's 1-hour target is 80µg/m³, and in the next section we will look at how often we high days.


High FPM2.5 Days Each Year
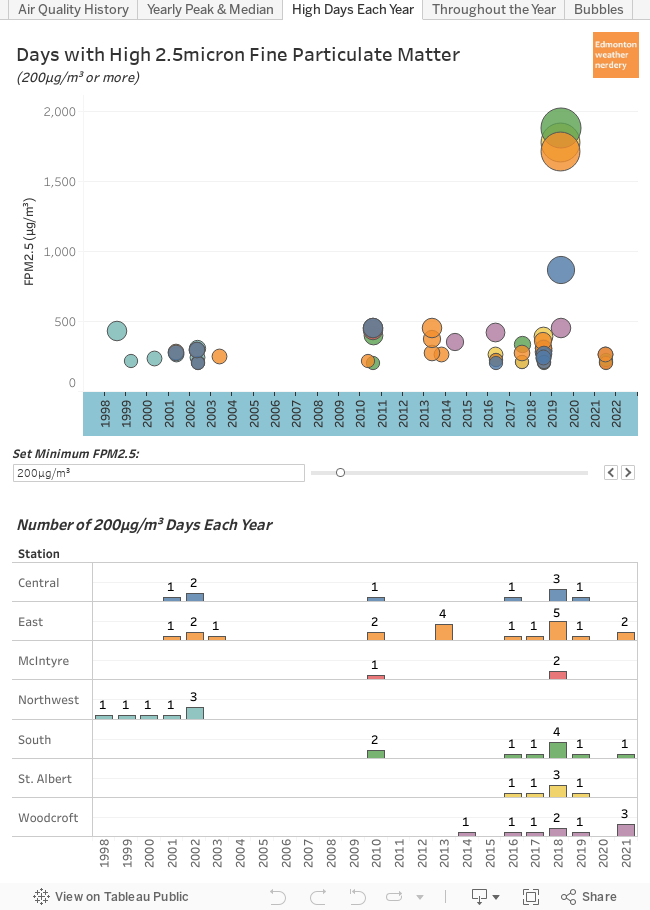


Here we are looking at the number of days with high FPM2.5 each year. The default for this dashboard is 200µg/m³ because that is a pretty bad day, but it can be adjusted to show 50µg/m³, or 100µg/m³, or 400µg/m³, or Alberta's target of 80µg/m³.

We've previously seen that 2010 & 2019 each had a really bad day, with FPM2.5 hitting more than 400µg/m³ and 800µg/m³ respectively. Those really bad days show up in the top part of this chart.

In the lower part of the chart we can also see that 2018 had a bunch of pretty bad days. The various stations recorded 3-5 days with FPM2.5 from 200-400µg/m³. That isn't as high as the peaks of 2010 & 2019, but in 2018 there were more days. If we lower the cutoff to 100µg/m³ (which is still pretty bad) 2018 had 6-8 days depending on the station, while 2010 had 4-7 and 2019 had 2.

These photos are from August 15th (average FPM2.5 of 187µg/m³), 16th (112µg/m³) & 17th (229µg/m³) 2018:


August 10th & 18th 2018 were both the worst of that week at 287µg/m³ and 293µg/m³, but I don't have any photos for those days. For most of the days that week the AQHI peaked from 8-14, and the daily AQIs were around 160-190. And in August 2018 things first got bad on August 7th with FPM2.5 of 74µg/m³, and they stayed pretty high until about August 26th.

So 2019 had one really, really bad day. 2010 had one really bad day, and a few more pretty bad days. And 2018 had a week of pretty bad days, and August was pretty rough overall.


FPM2.5 Throughout the Year
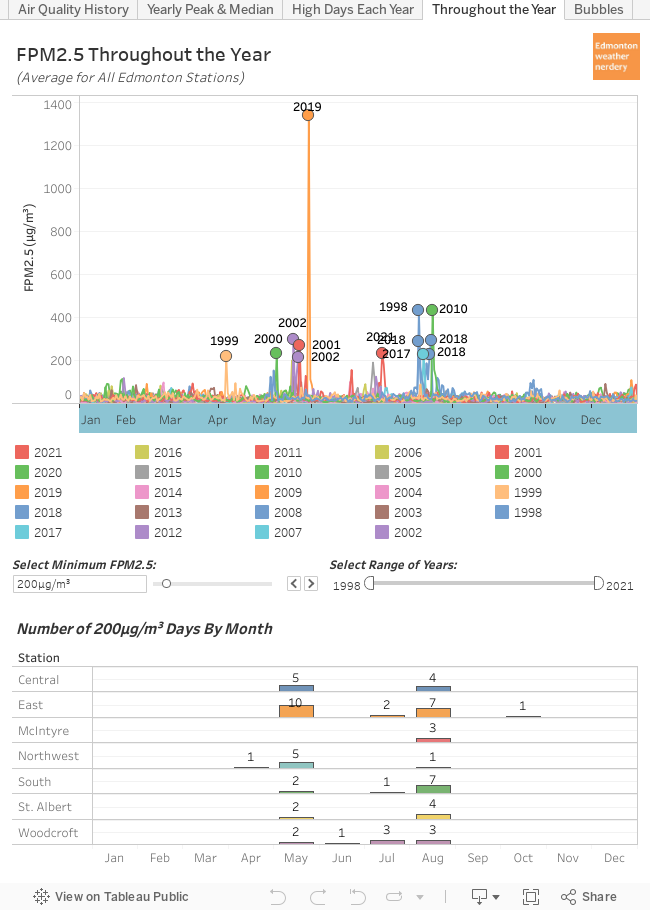


When our air turned to soup on May 30, 2019 a lot of people were saying "It's never this bad in May." We've already seen that May 30, 2019 was undeniably the worst-of-the-worst-of-the-worst, but this chart shows when throughout the year we get other pretty bad air quality days.

In the past 20 years our pretty bad air quality days have mostly been split between May and August:
  • For May
    • May 30, 2019 was terrible.
    • The Ft. McMurray wildfire was at the very beginning of May 2016, and Edmonton's air quality was generally fine, except for a single 200µg/m³ day on May 19th.
    • 1998, 2000, 2001 & 2002 all had high FPM2.5 days in May.
  • For August
    • August 2018 had a whole bunch of pretty bad days.
    • August 19, 2010 was a very bad day.

So it is true that in recent years August is the month for bad air quality, but going back a little bit further May has a history of it too.


Summary

Today we have mostly focused on the amount of 2.5micron Particulate Matter in the air. FPM2.5 is important because it is used to calculate the AQHI and AQI which are reported whenever the air quality is poor.
  • May 30, 2019 was Edmonton's worst air-quality day since 1998 by far. August 19, 2010 was the 2nd worst, but it wasn't even close. It is unfortunate that the data doesn't go further back than 1998, though.
  • August 2018 was also notable, with about a week of pretty bad days.
  • Recently August has had most of our bad days, but around 2000 there were also a number of them in May.
  • Over the past 20 years our "typical" FPM2.5 throughout the year has stayed fairly consistent at around 20µg/m³. And the worst days each year typically peak at 150-400µg/m³...until May 30, 2019 averaging 1,338µg/m³ for all the stations.
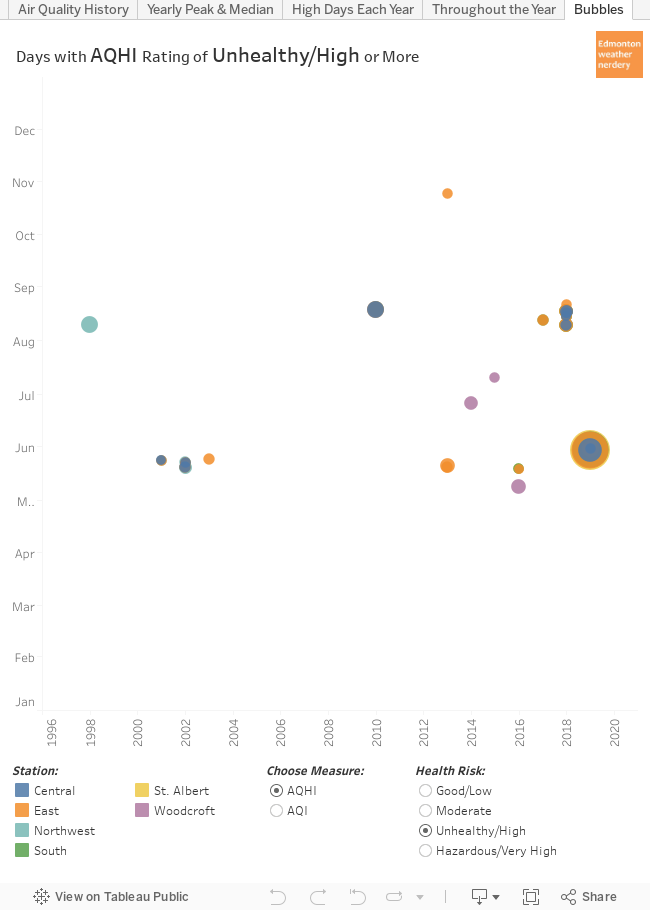

This final dashboard lets you filter by all the unhealthy/high/hazardous days at the various stations, using either AQHI or AQI. The ratings aren't a 1-to-1 match: in particular AQI puts a lot of days in the moderate category that AQHI ranks as low. But for the days with poor air quality the two scales have a lot in common.

Hopefully this all gives some context to Edmonton's recent history of Air Quality. The next time that the smoke rolls in it is important to remember the difference between the AQHI (Canadian, with a range of 1-10+) and the AQI (International, with a range of 0-500), and that both of them are mostly calculated using the FPM2.5.

2019/08/05

The North Saskatchewan River - from Top to Bottom

Today we are going to take a deep dive into the North Saskatchewan river in Edmonton. We will be using a whole series of interactive dashboards, and if you have ever had any questions about the river you might be able to find the answers here.


History: 1911-Present


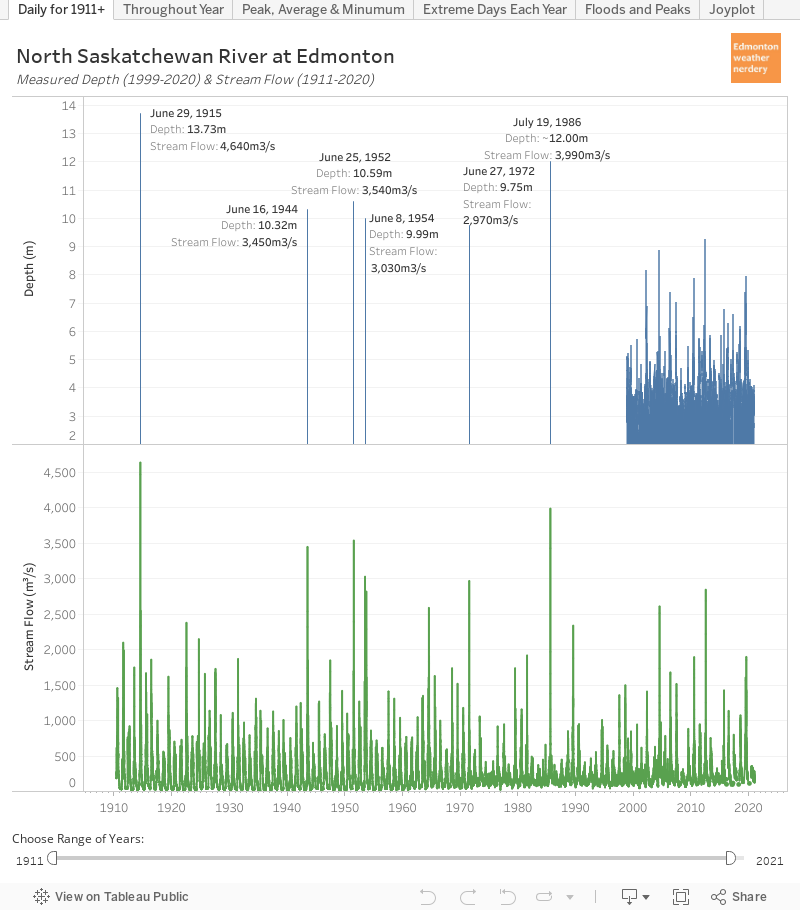
To get things started, here we have daily data recorded at the Low Level bridge.
  • Stream Flow (m3/s) recordings in green go all the way back to 1911.
  • Depth (m) in blue starts in 1999.

The river level and flow fluctuate throughout the year, and the tall green and blue spikes represent floods and other high flow conditions.

Edmonton's largest recorded flood was June 29, 1915 with the water rising to 13.73m and 4,640m3/s:

From: https://citymuseumedmonton.ca/2015/06/29/june-29-1915-edmontons-river-valley-floods/

The photo of the Low Level Bridge with a freight train being used as ballast is quite well known, but the second photo of the Dawson bridge shows just how far the river spilled over its banks.

For some context, the river's average depth in the summer is around 3.5m with a stream flow of 300m3/s. During the great flood of 1915 the river's height was 10m (or 30'/3 storeys) above average, and the volume of water was about 15x more than average.

The second largest recorded flood was just over 30 years ago in 1986. The stream flow peaked at 3,990m3/s, and the depth was about 12m although I couldn't find an exact number for that. There are also reports of a large flood in August 1899 which reached 12.61m, but the records for that aren't complete. Other large floods were June 25, 1952 at 3,540m3/s and 10.59m, and 1944, 1954 and 1972 were also all around the 10m mark.

In recent years on June 23, 2013 the river reached 2,847m3/s and 9.25m. That was the same week that Calgary had its large flood. 2005 was another big year reaching 2,612m3/s and 8.85m.

This is what the 2013 mini-flood looked like:


Changes Throughout the Year


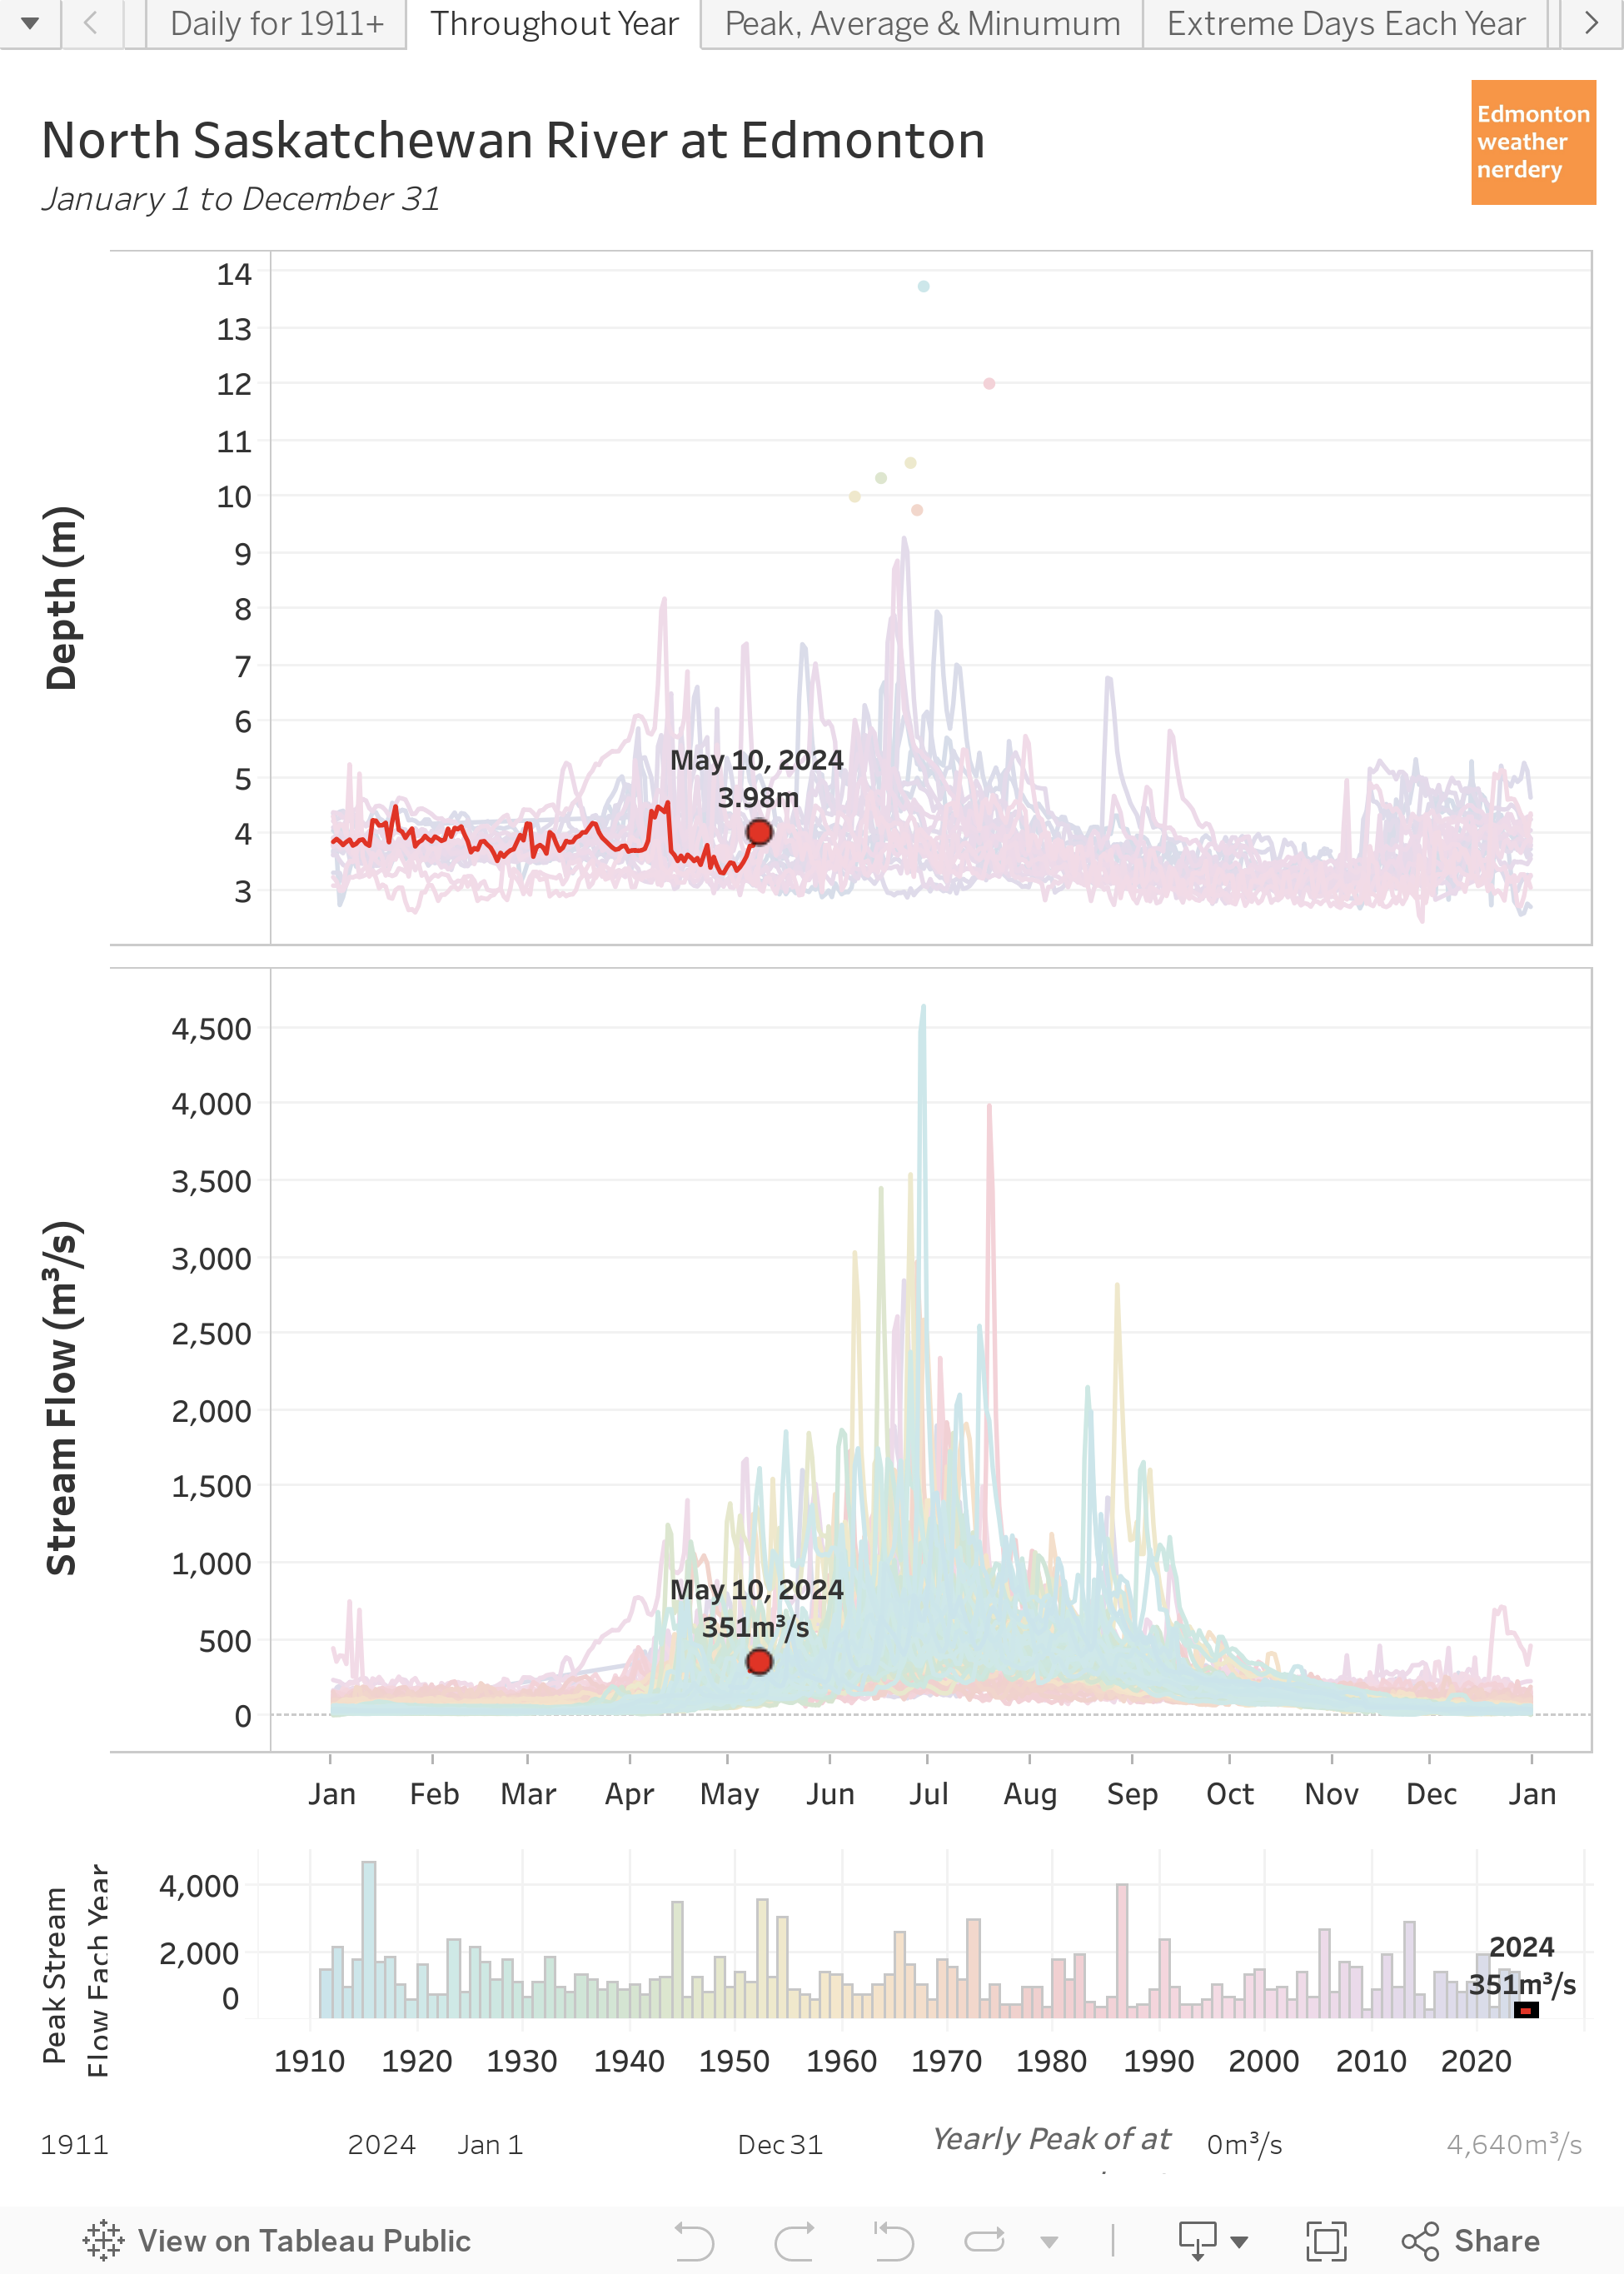
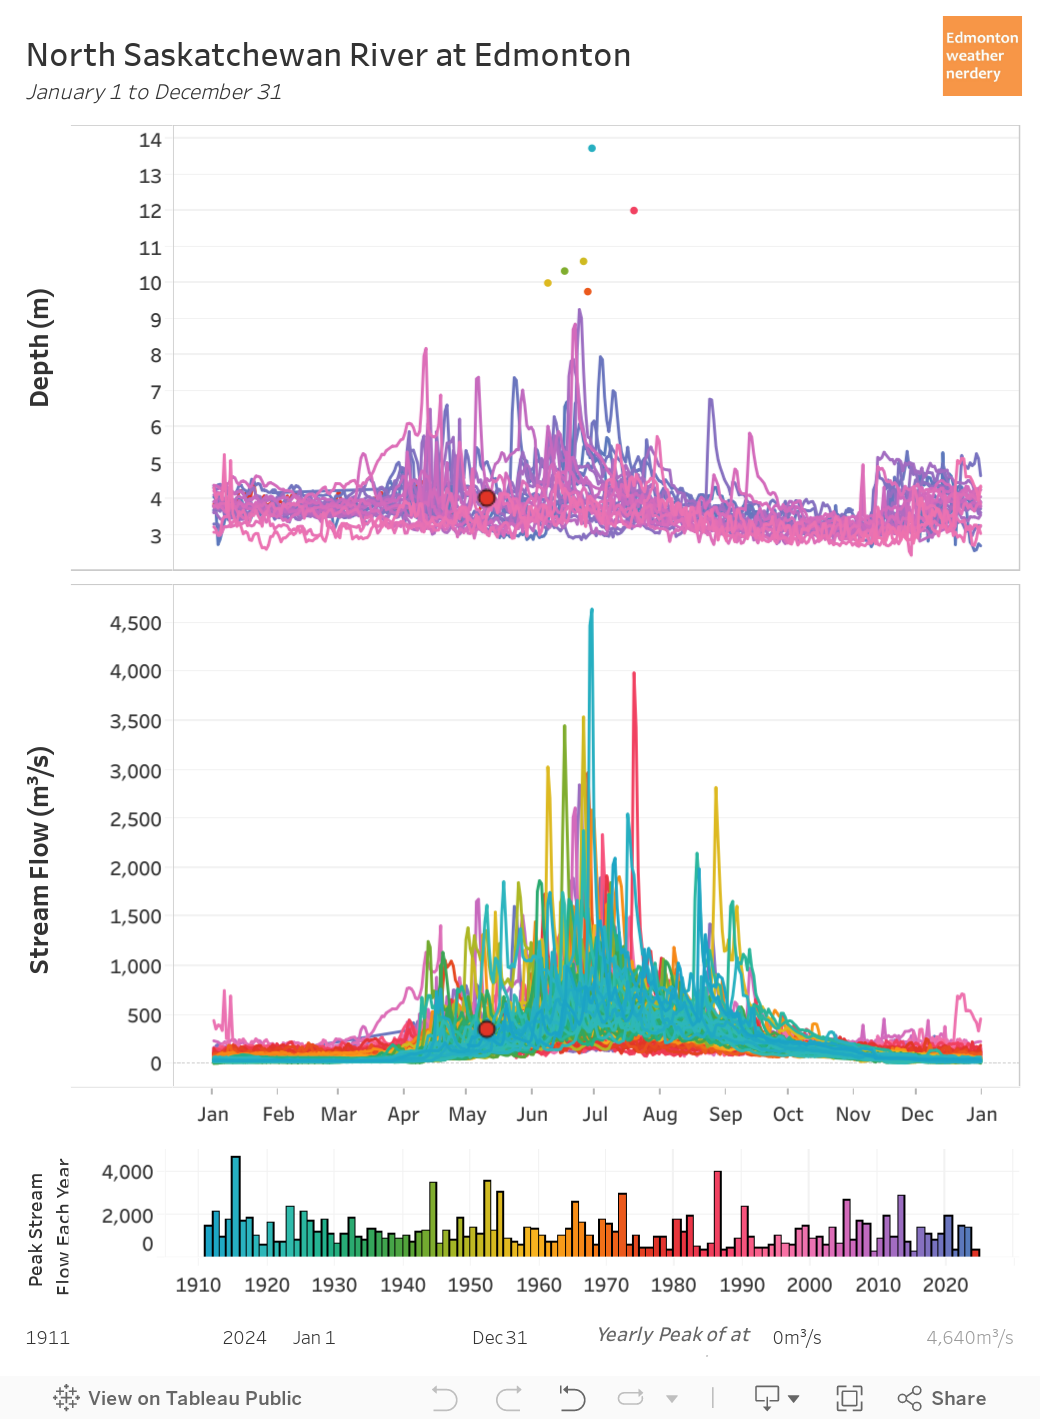
Here we have all of that daily data rolled into the calendar year from January-December.

Two caveats for this chart:

  • the depth data is only available for 1999 onward, so if you click through the various years the upper chart will be blank for 1911-1998.
  • I'm not really sure how accurate the readings are during the winter - for recent years since 2015 the winter stream flows aren't even measured.

With that said the river fluctuates throughout the year and has a fairly reliable peak in late-June or early-July. All of the largest floods occurred in June & July, but some years - 2003, 2007 & 2018 - also recorded big spikes in April & May during spring runoff.

One other thing to look for here is 2017, which is the year that the "accidental beach" hit the news. That summer the river depth was below 3.5m starting in early August, and that is low but it isn't really low.


3.5m is around the middle of the range for late-summer, but in 2018 the depth stayed closer to 4m through the end of the summer, and for 2019 so far we have generally been over 4.5m.

Beach to the left of me, Cloverdale to the right.
The beach was still around in 2018 & 2019, but the higher water levels create a wide (but not particularly deep) channel between it and Cloverdale which makes it hard for people to get to.


Changes Over Time


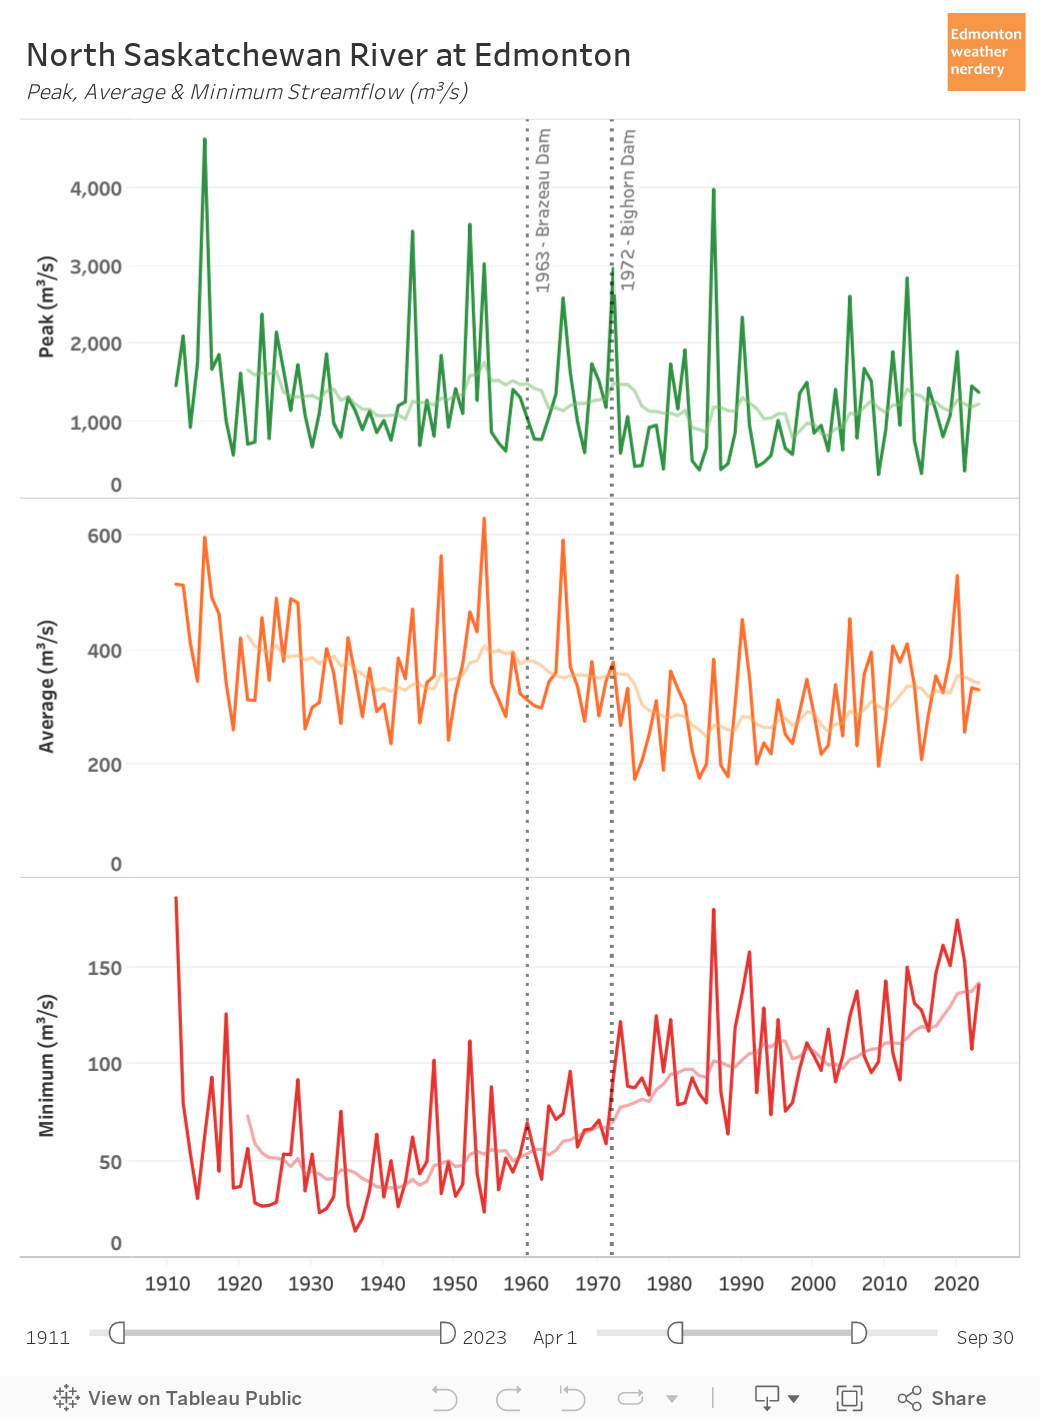
Are there any trends over the past century? That's a complicated question, because in 1963 the Brazeau Dam was constructed, and then in 1972 the Big Horn Dam was added. Those dams change the river's behavior throughout the year.

People often think that dams will stop floods, but once the reservoir behind a dam is full there's nothing more it can do. And so Edmonton's second largest recorded flood was in 1986, after both of the dams were built.

When we look at the peak stream flow each year it has averaged 1,100m3/s since 1911, and that average hasn't really changed since the construction of the dams. We have had a few less spikes though, because in the 61 years prior to the dams being built there were 6 years where the river peaked above 2,500m3/s, and in the 47 years since only 3 years have reached that high.

For the average flow during the summer, following the construction of the dams the average flow has been around 300m3/s, with some years just below 200m3/s while others have been as high as 400m3/s. Overall that is down compared to before the dams when the average was closer to 350m3/s, and the individual years typically ranged from 250m3/s to 450m3/s.

The most noticeable change here is on the low-end, with the river currently bottoming-out on average at around 100m3/s each year. Prior to the construction of the dams the average-minimum was half of that, at around 50m3/s.

Taproot Edmonton recently did a discussion of the history of the dams in: Dam Complicated. It high-lighted the importance of the dams for maintaining that minimum flow throughout the year - to provide a reliable supply for drinking water, agriculture, and industry (and also power generation).


Extreme Days


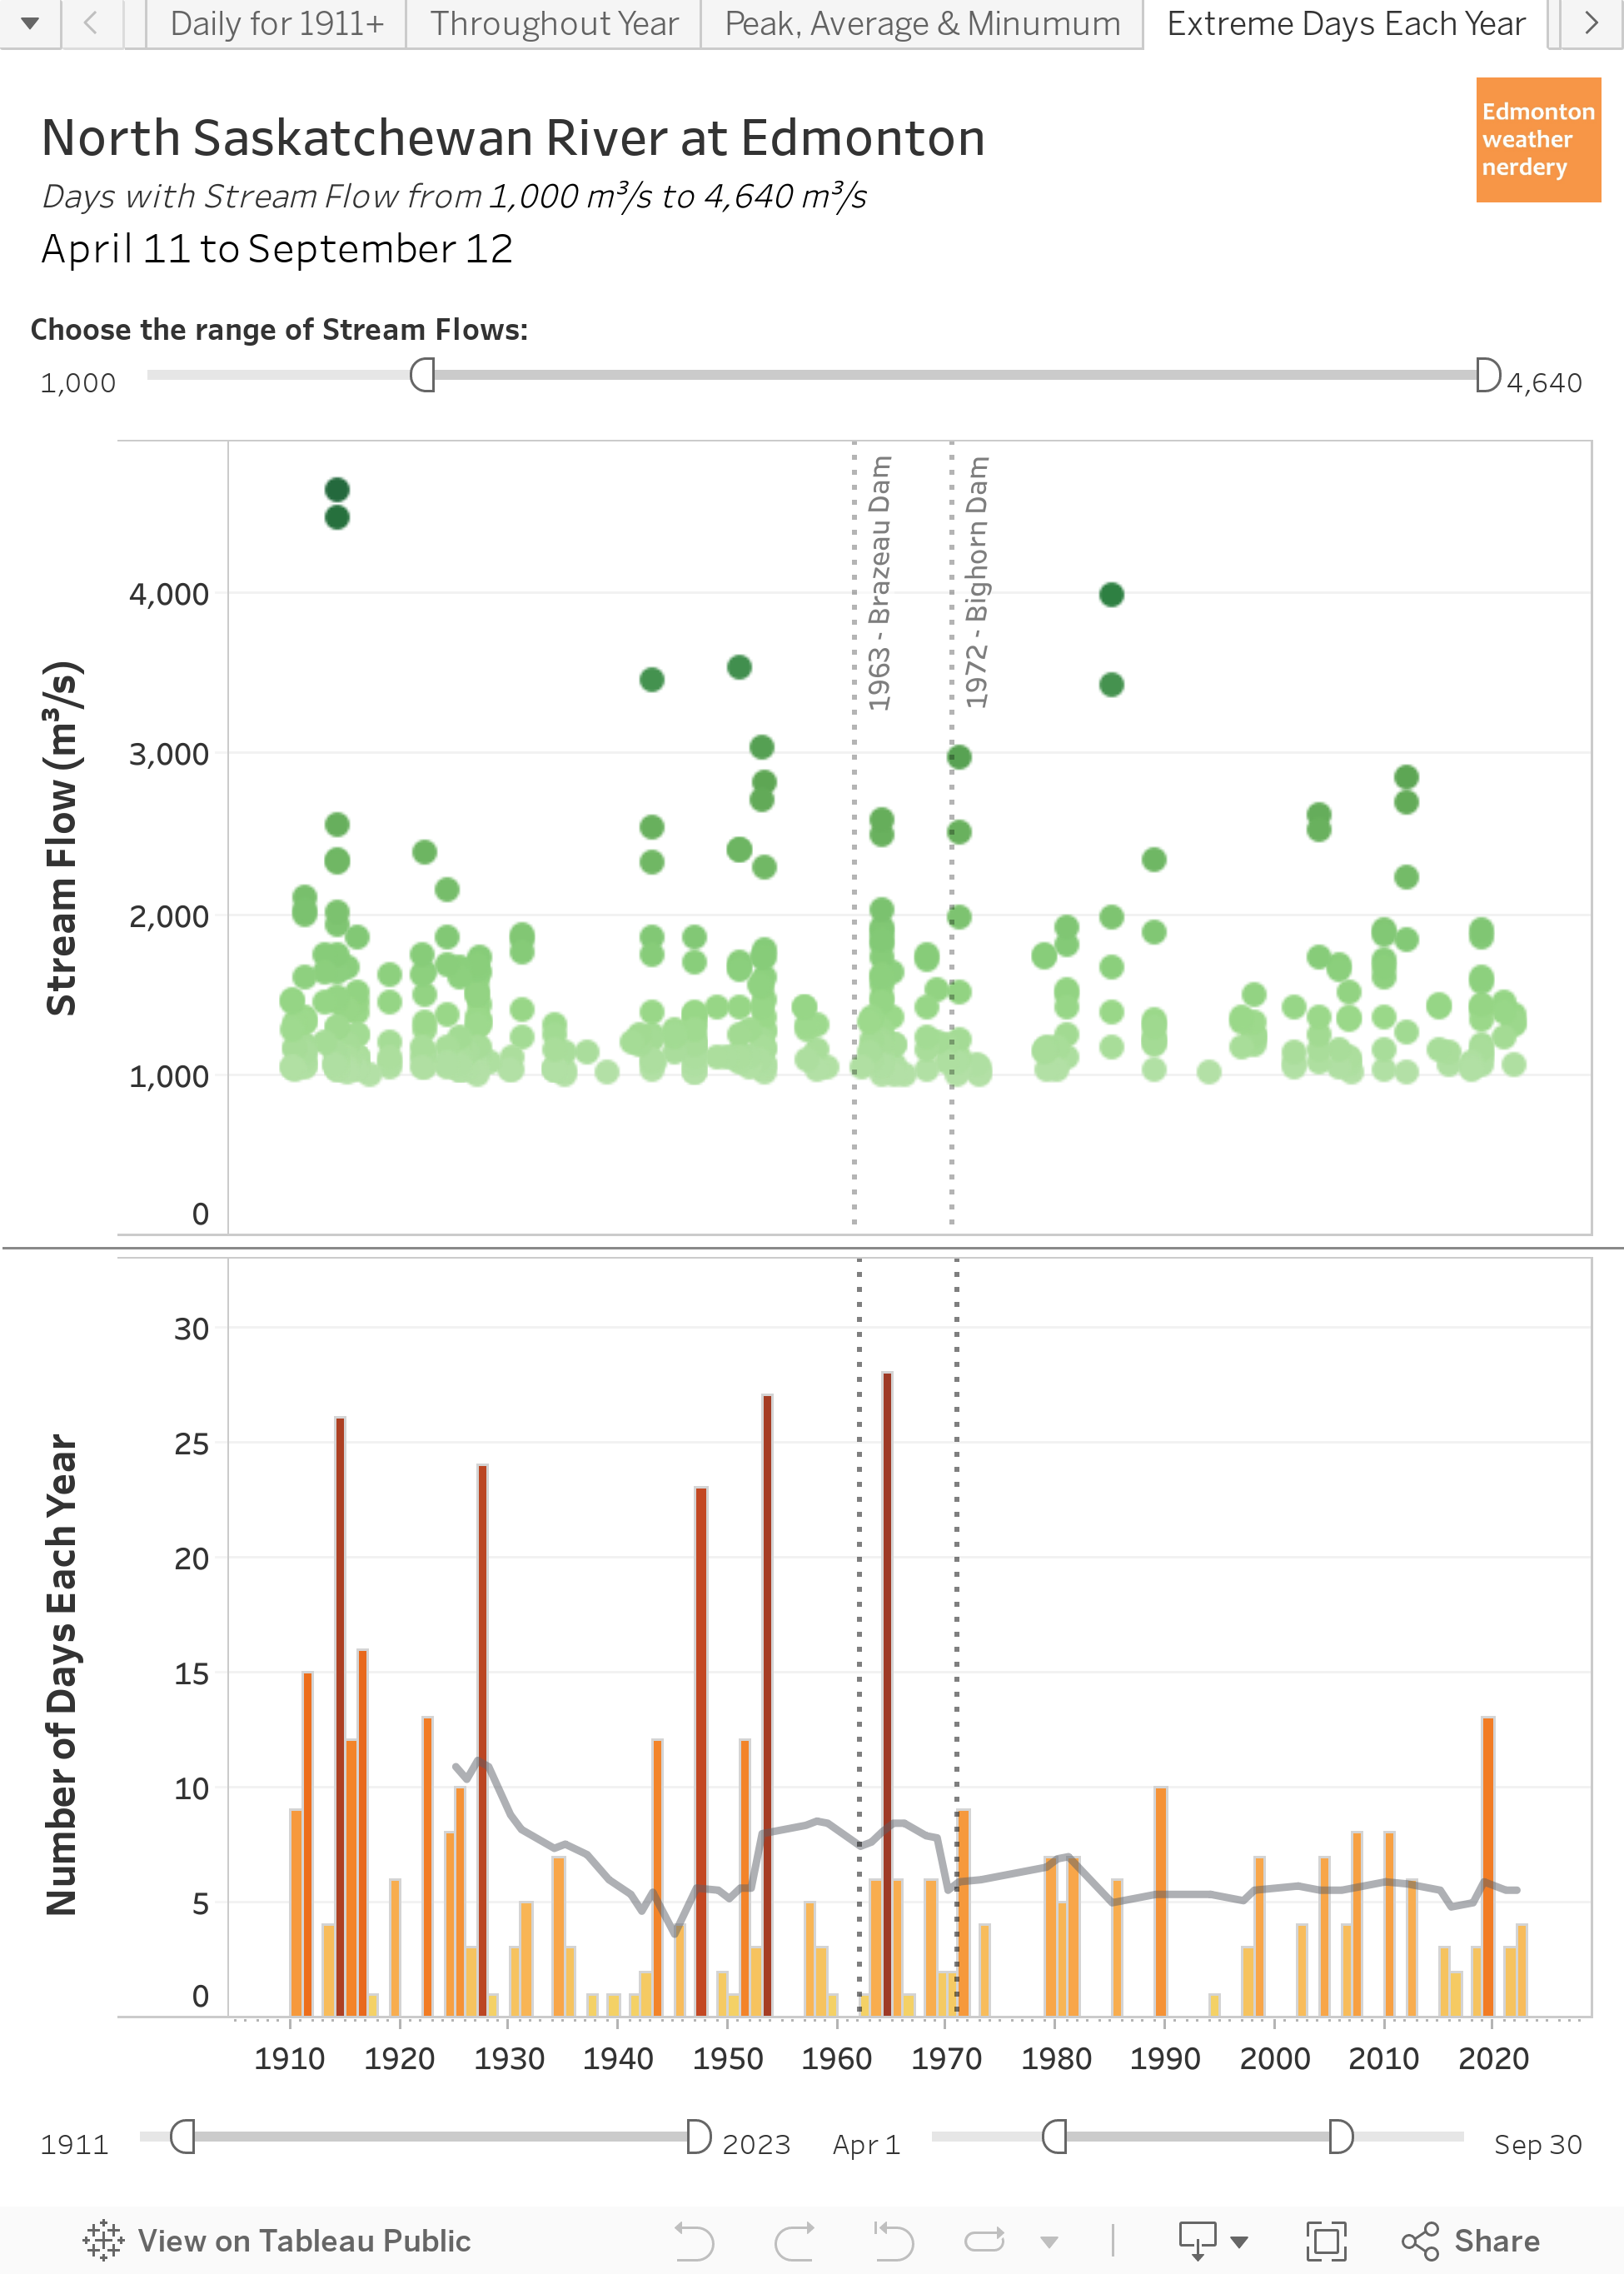
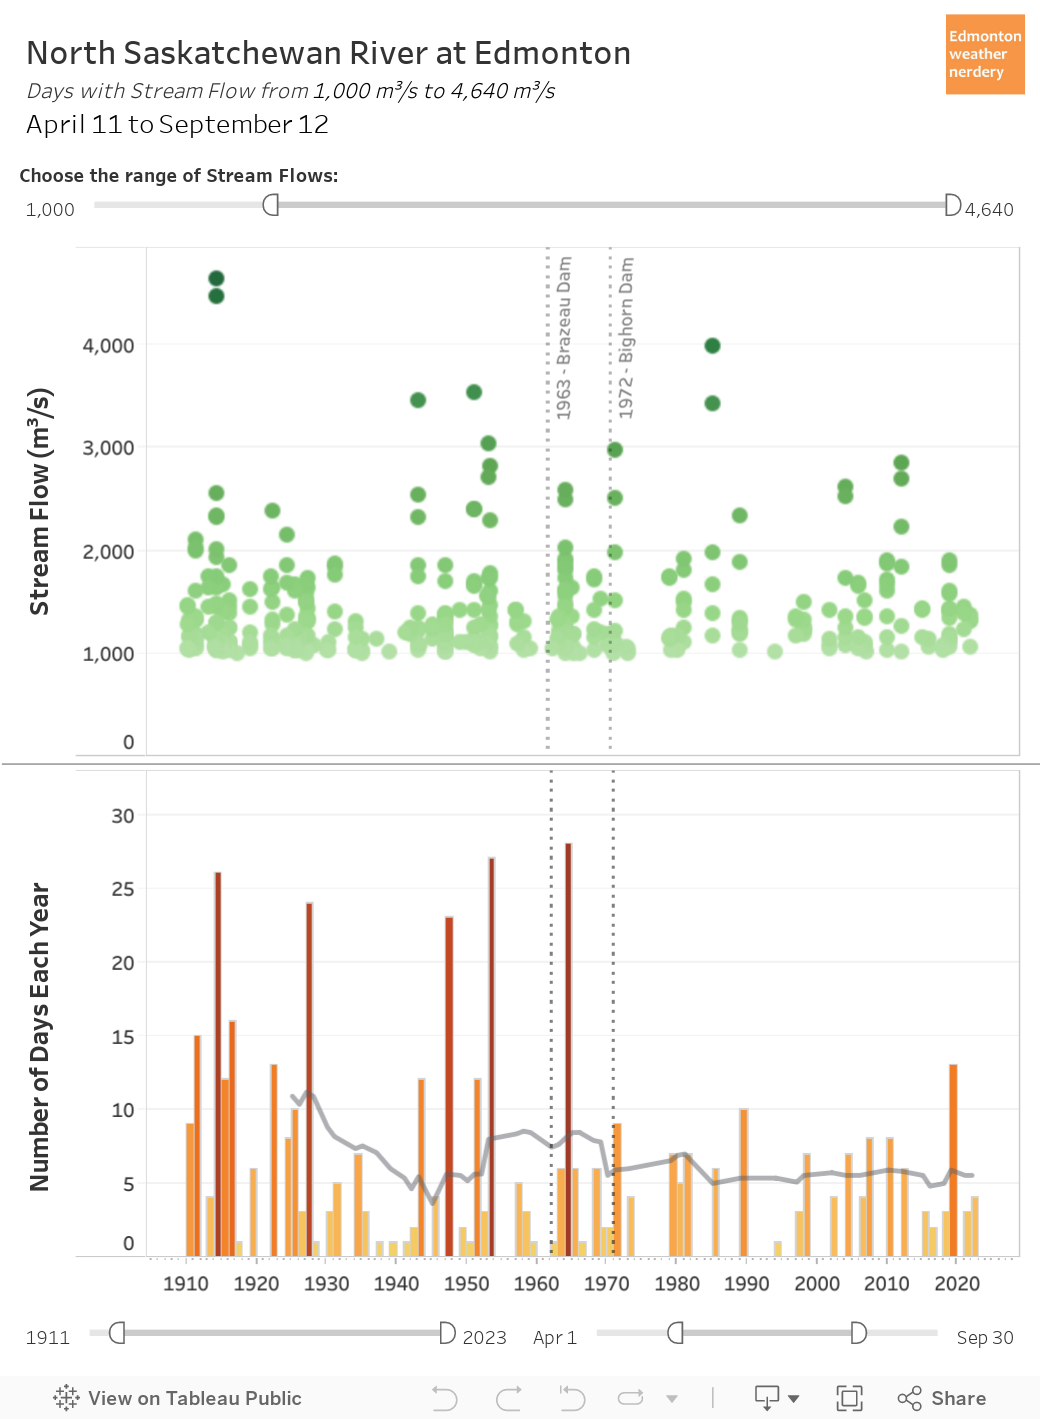
This dashboard lets us compare the number of high or low days each year, and we will start with the high days and flows of at least 1,000m3/s.

1,000m3/s isn't a flood, but it is on the high end of the river's typical range. And here we can see that the number of 1,000+m3/s has become much less variable since the construction of the dams. Since 1972 the high years have had at most 8-10 days with 1,000m3/s per year, while prior to the dams some years had 15 or even 25 days.


Flipping things around, here we have the number of low stream flow days each year. Since the construction of the dams the number of days with stream flow below 100m3/s has plummeted from an average of more than 150 days per year a century ago to less than 50 days today.

So the dams have moderated the high-flow days a bit, and have greatly reduced the number of low-flow days.


The Floods


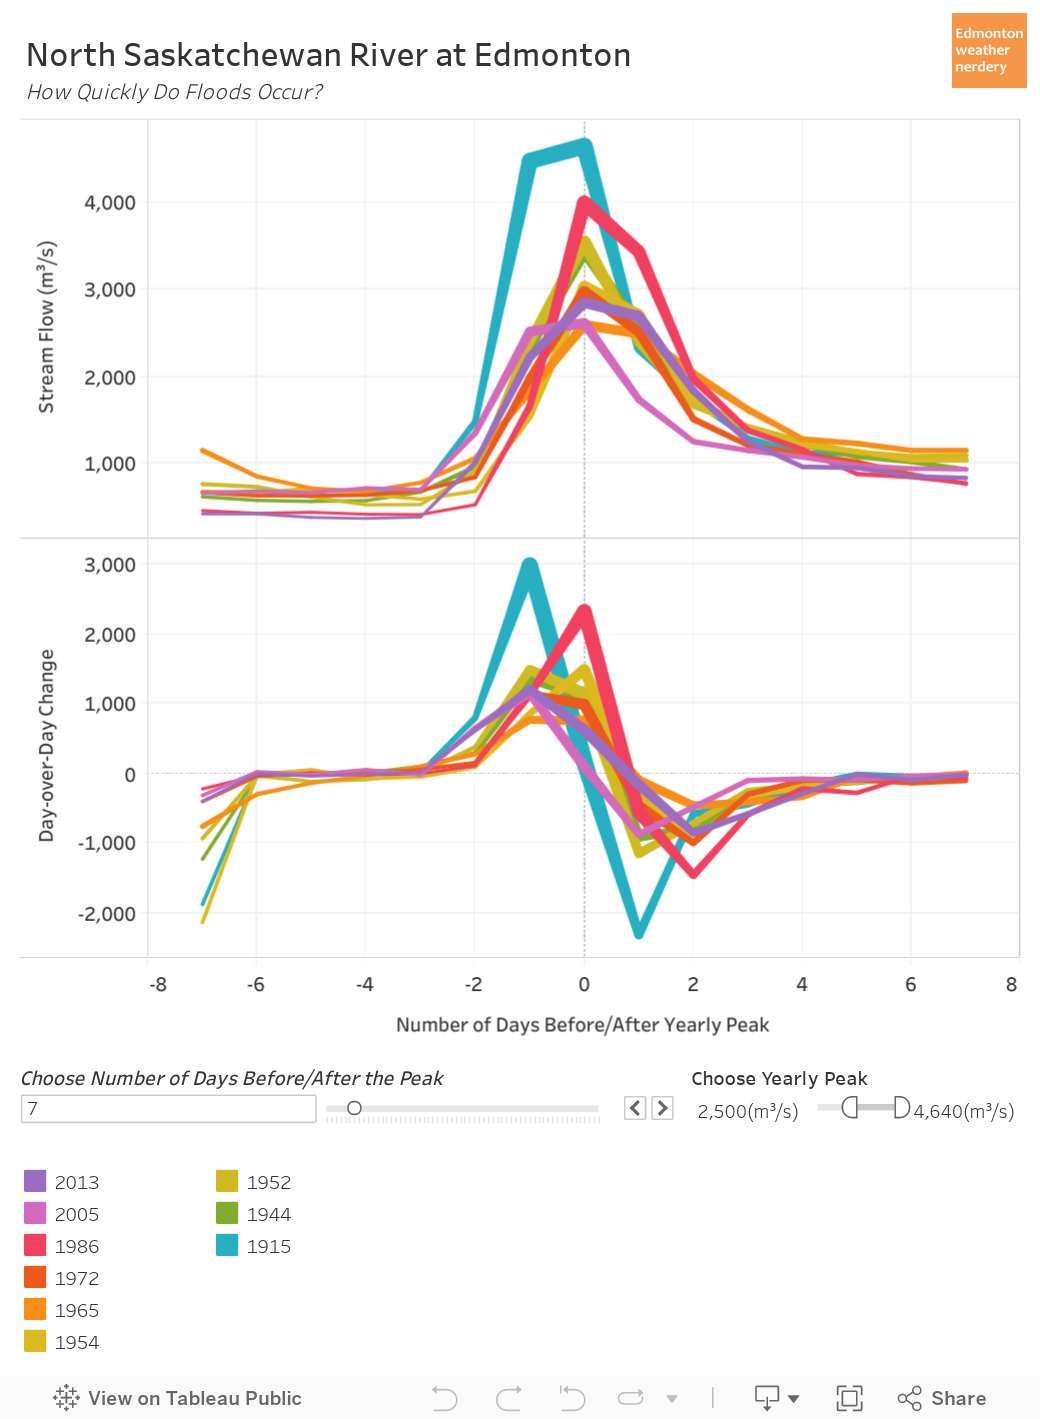
And finally, in this dashboard we can compare how quickly the streamflow changed in the days immediately before and after Edmonton's historic floods. The first chart shows the streamflow each day, and the second shows the day-over-day difference.

Our most recent big flood in 2013 ramped-up from 400m3/s to 2,847m3/s over the course of 3 days. And then by 4 after the peak things were back down to around 1,000m3/s.

The great flood of 1915 took 2 days to go from 700m3/s to 4,470m3/s, and then on day 3 it increased a little bit more to 4,640m3/s. Then within 4 days it was back down to around 1,000m3/s. For a bit of trivia: during Calgary's big 2013 flood the Bow River peaked at 1,840m3/s and the Elbow peaked at 700m3/s, for a combined total of about 2,540m3/s.

Comparing all of these curves the ramp-up typically takes 2~3 days to go from average~ish to peak, with volumes that are 8x, 10x or even 15x above average. And then things ramp down a bit more slowly settling at around 1,000m3/s after a week.

And that's it for our big look at the North Saskatchewan River in Edmonton. I hope that this will be one of the more comprehensive discussions of the river that you will ever find, but if I've missed anything please let me know in the comments, or send me a message on twitter at https://twitter.com/yegwxnerdery.

2019/07/14

Hot & Cold Days - Dashboard

Today we are going to take a look at two more interactive dashboards, and these ones will let you look at Edmonton's history of really warm & really cold days.

We talk about temperatures a lot around here, and these old posts have some detailed discussion on what we will see in the dashboards:


But now let's look at the dashboards:

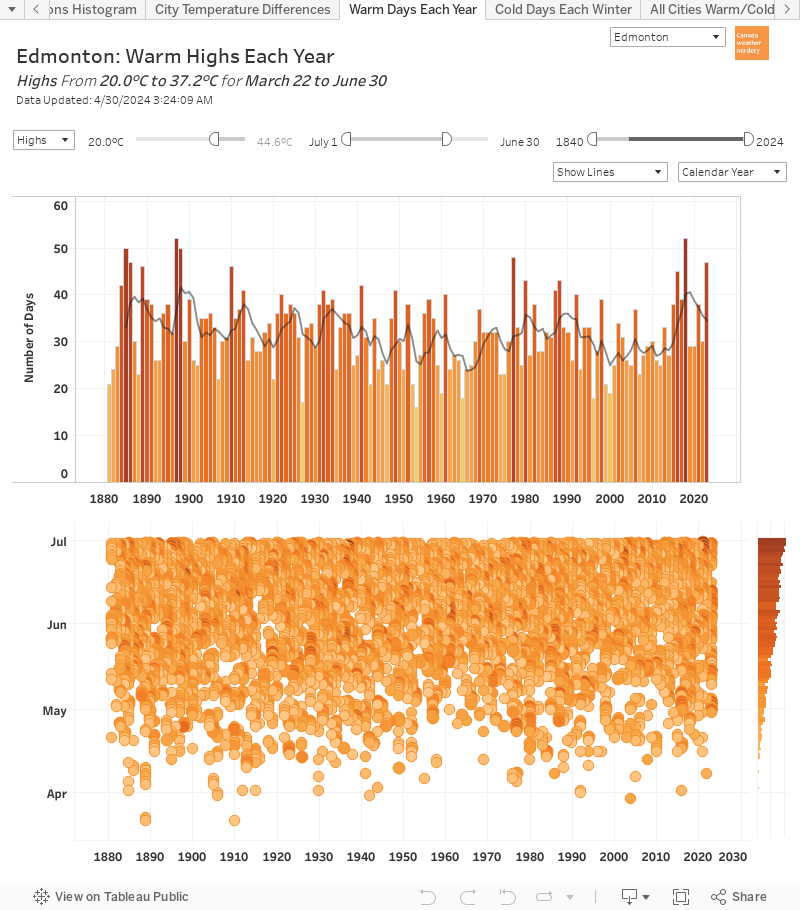
Warm Days Each Year Dashboard


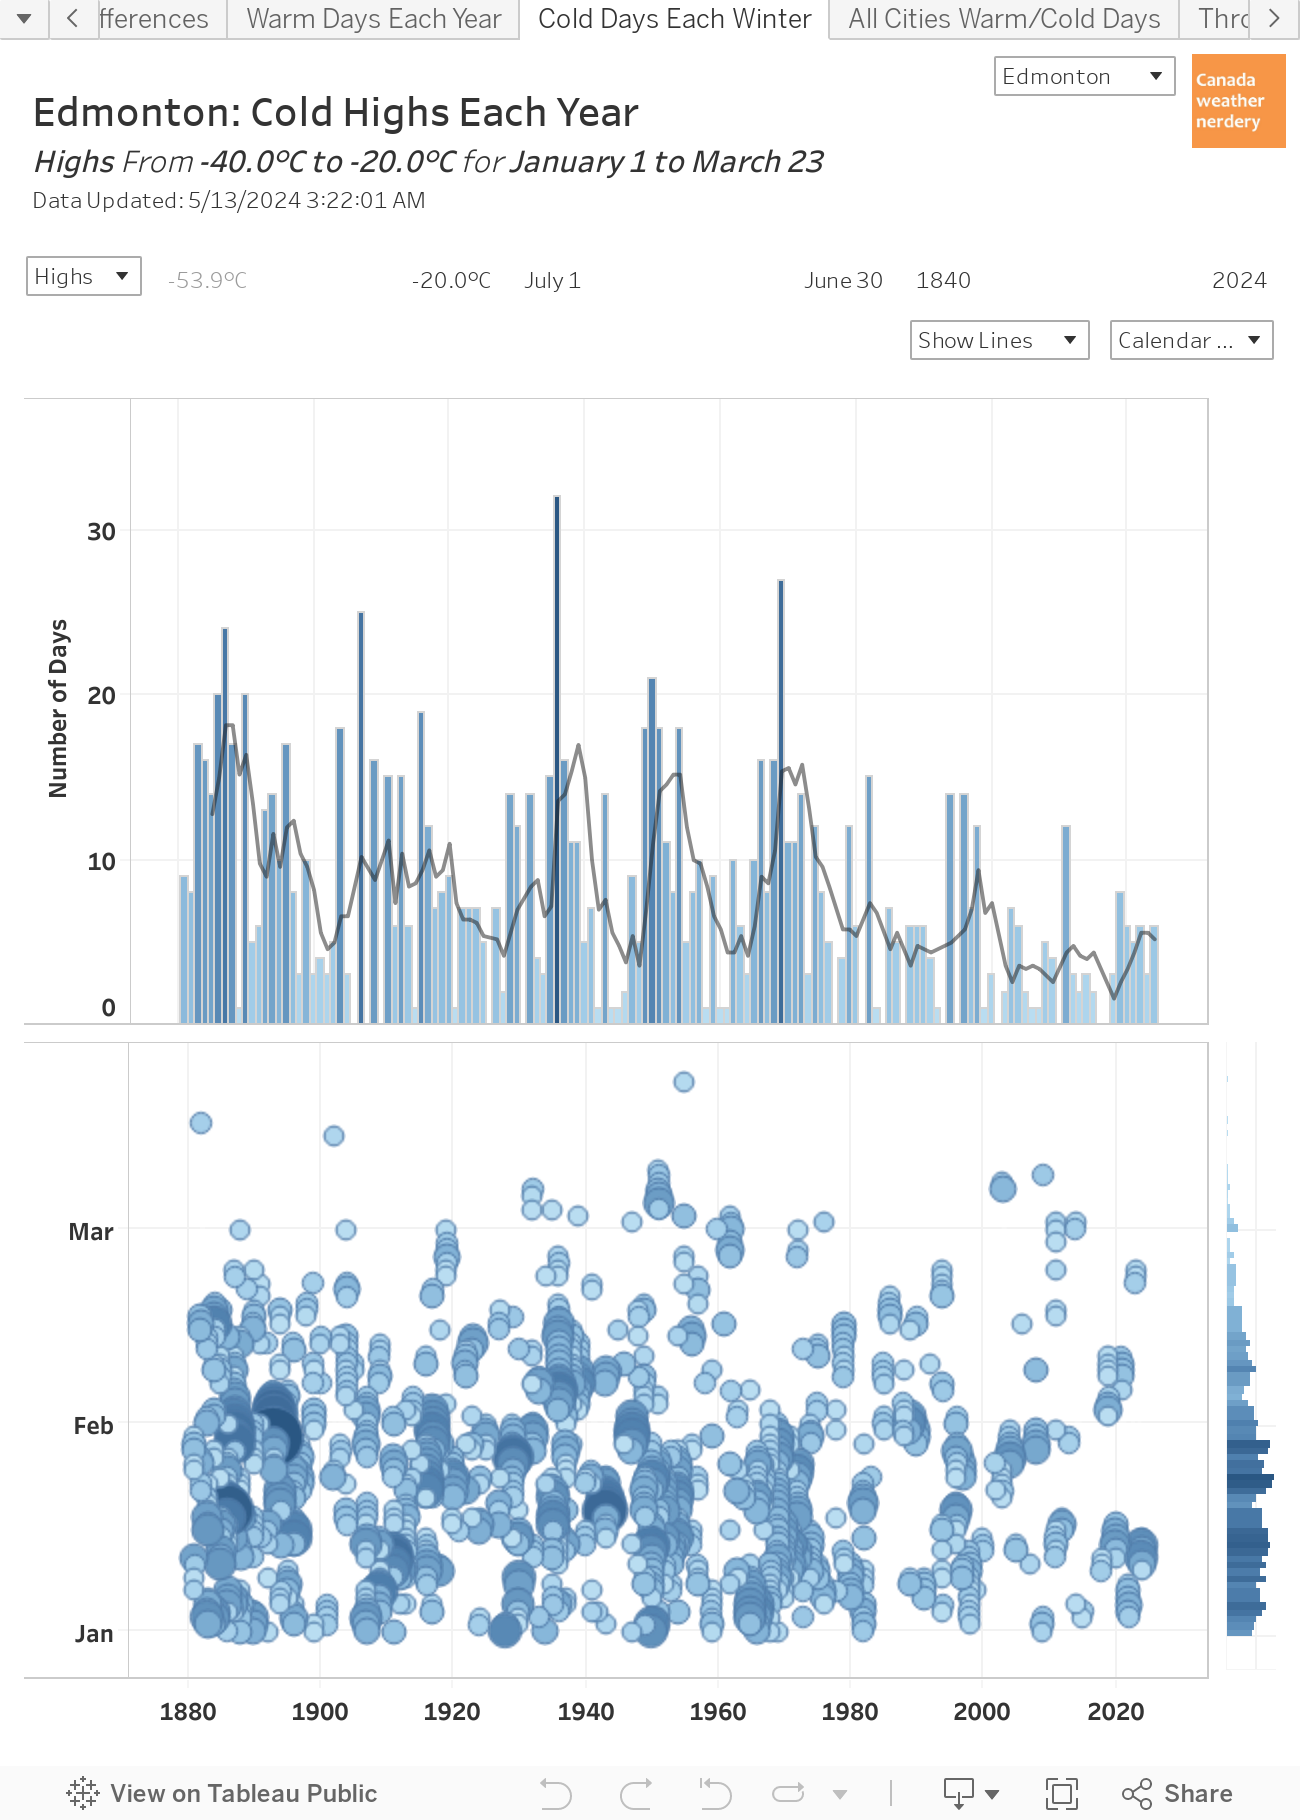
Cold Days Each Winter Dashboard

Both dashboards work the same way, but the warm days are grouped by Year (Jan-Dec) while the cold days are grouped by Winter (Jul-Jun).

Now we will take a look at some examples of how these can be used:

Warm Highs Each Year

The simplest thing we can do with these dashboards is to see all of the warm days for each year. This example image is for Highs of 25°C, but we can change that to 20°C or 30° or even 0°C.

With all of the history we can see which years had a lot or a few warm days, how things have changed over time, and when throughout the year the warm days occur.


Cold Lows Each Winter

And here's the cold version of the previous example, with the number of -25°C Lows each winter. Last winter 2018-2019 had more than average, but over the last century that average has fallen from close to 40 -25°C Lows each winter down to about 10.


Extremes: 33°C Highs

We can also use these dashboards to look at extreme temperatures. In this example we have all of Edmonton's Highs of 33°C or more, going back to 1880.


Late Frosts

Here we are looking at the history of frosts after May 15. To keep things simple we've limited this to recent years from 1985 onwards.


Slow Summers

The summer of 2019 has gotten off to a slow start, with a cold June & early-July.

Here the dashboard shows the number of 25°C days each year between June 1 & July 12. 2019 had 5 days, which is definitely on the low side of things, and is well below the last 4 years, but it isn't record-breakingly cold.


Early Winters

Here we have all of the -20°C Lows that occur really early in the winter, from mid-October to mid-November. The ridiculously cold Halloween of 1984 shows up with its low of -24°C.


Melty Winter Days

This chart shows how many High above freezing we get each January. This is something we've talked a lot about on this blog in the past, because Edmonton has always has mid-winter melts. But in recent January's we are at the top of the range, and it's less variable with most years being up over 10.


Cold Februarys

And finally, the February of 2019 was really cold - but how cold was it? Here we have the number of -25°C Lows each February. 2019's 16 was well below the records from back in the 1930s, but it was about 10 more than any February since 1979.

That's it for our tour of these two dashboards. They provide lots of interesting ways to slice and dice the data for Edmonton's warmest and coldest days.

2019/07/13

Daily Temperatures & Precipitation - Dashboard

Recently I have built a whole bunch of interactive dashboards to help visualize weather data. In the next few posts we will be taking a closer look at them to see how they can be used.

Today we are going to start with an easy one: Blatchford's High Temperatures, Low Temperatures, and Precipitation going back to 1880.


For these instructions I will be linking to fixed images, but this widget will let you try things out.


Daily Temperatures & Precipitation

If you were curious about Edmonton's history of Christmas you can set the data to December 25, and you will get the daily history going back to 1880:
  • The daily High temperatures for each year, along with the 30-year average, and the record warmest & coldest.
  • The daily Low temperatures, 30-year average, and records.
  • The daily Snow (grey), Rain (blue) or total Precipitation (green).
    For 1880-2007 the Blatchford station measured Rain and Snow separately, but that changed and for recent years only the total Precipitation (Rain & Snow combined) is available.
So that's fun. But you can also use this chart to select multiple days:


Weekly Temperatures & Precipitation
Here we have the same chart, but this time "Choose Day(s)" is set to include December 25-31.

Here we have the average temperatures & total precipitation for the whole week from Christmas to New Year's. This could be done for a week, or a few days, or a few weeks.


Monthly Temperatures & Precipitation
Taking things one step further here we are looking at the entire month of December. You could also select several months, to combine the summer months of June, July & August together.


Recent Years

And finally, if more than a century of data is just too much you can use the "Choose Range of Years" to filter the results down to a more reasonable range.

So that's it. It's pretty simple, but it provides a lot of flexibility to poke around through the data. This is just one of several new dashboards, and some of the others are accessible using the tabs at the top of the widget. In future posts we will spend some time going through all of them.

2016/09/07

How warm is 2016? (September Edition)

A few weeks ago I looked at Edmonton's warmest and coldest years, relative to the average temperatures for the 20th century:


I couldn't include 2016 in that comparison because there are still several months left, and that wouldn't have been fair.

But today we'll be looking at each year on a day-to-day basis, so we can see exactly how 2016 stacks up against all the rest.

There is a tonne of data today, and I'm struggling a bit with how exactly to present it, so we're going to take things in steps.

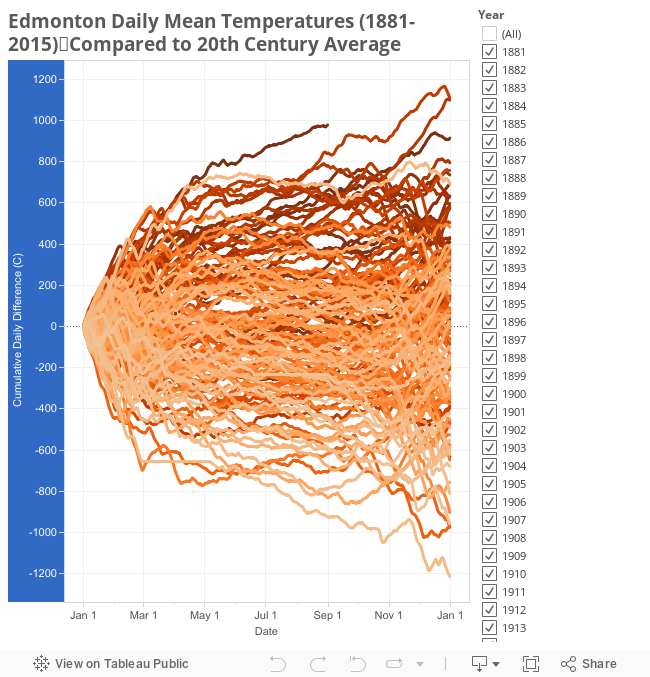
To start things off, here's the whole mess of data:


The thing to take from this chart, is that 2016 is warm. It's the orange line that is above the rest of the giant mess.

Beyond that though, this is basically impossible to read. What it is trying to show is how each year from 1881-2016 varied from the 20th century average, on a day-to-day basis.

To clean things up a bit, here is the same data condensed into Highs/Lows/Quartiles, with 2015 shown as a reference:


I hope that gives a bit of a clearer idea of what's going on.

For both 2016 and 2015 the first few weeks of January were actually pretty cold: a little above the 20th century average for 2016, and actually a bit below that for 2015. But by late January both years had picked up and were above the 75th percentile (although just as a reminder, this is a comparison to 136 years, and not just to recent history). By the time we'd reach April, 2016 was the warmest year ever recorded, while 2015 climbed pretty steadily for the whole year.

As of August 31 the score for 2016 is 978°C, and for all of 2015 the total score was 914°C. What do those numbers mean? Unfortunately they're pretty abstract, and aren't actually anything that you can feel. Here is an explanation of where they come from, using 2015 as an example:

The top section of this chart shows the 20th century average temperature for each day of the year, as well as the actual temperature that was recorded in 2015. Oranges are days when 2015 was warmer than the 20th century average, and blues are cooler.

The bottom section is a running total of all of those differences for the year. So if today's weather report says that it was 20°C today, but the average for this time of year is only 15°C, then that would be a difference of 5°C. (with a note that this uses the mean temperature for the day, rather than the daily high or low, but the general idea is the same). The combination of all of those daily differences gives us the total score of 914°C for 2015.

So a score of 978°C for the first 8 months of 2016 isn't something that you can feel, but as a way to calculate a running-total for each year it seems to make sense.

For a little bit more context, here is 2016 compared to the last 10 years:


With this we can see that 2015 is quite a bit higher than the others. 2006 and 2005 are in 8th and 9th place overall, with totals around 600°C, compared to 2015's 914°C which is in 3rd spot. And the coolest year was 2009 in 68th place, which actually stayed quite close to the 20th century average for the whole year.

While all of the last 10 years ended up above the 20th century average, it's maybe a little interesting that 4 of them didn't break the 75th percentile range. Looking at 136 years of data I'd have expected recent years to be really high, but a year like 2009 is right in the middle of the pack.

Here are the day-to-day timelines for the top 10 years (2015, 2006 and 2005 were in the previous graph, as well as in this one):


It's a little bit tough to read because they're all grouped quite tightly, but 1981 and 1987 in 1st and 2nd spots have a respectable gap over all the rest. And buried right in the middle of that is the mysterious 1889 in 7th place.

Digging into things just a little bit more, here is 2016 compared to the previous top 3 - 1981, 1987 and 2015.


Again we see that January 2016 was pretty boring, but after that things really took off. 2016 started challenging for 1st place in early March, and by April it was well in the lead.

Looking at the summers, even though this year didn't seem particularly warm, we can see that 2016 basically kept pace with the other years - 1981 and 1987 both actually dropped off a bit in June-August compared to 2015 and 2016. But then both 1981 and 1987 really took off again in October.

There are still 4 months left in 2016, so where are we likely to end up?


Here is the September through December graph for the last 10 years, to give an idea of what is "typical" for fall and early winter.

Getting back to the idea of "points", for September through December the average for the last 10 years is a score of 84. 2011 had the warmest final 4 months with 370 points, and 2012 was the coldest with -220.

This next chart takes those recent histories, and adds them onto the end of 2016:


Here the light grey lines show what recent falls have looked like.

As of August 31, 2016 is at 978. The end-of-year scores for the 3 previous warmest years are 1981 with 1,109; 1987 with 1,099; and 2015 with 914.

So if this fall is "average" then 2016 will end up at around 1,060 points, putting it 3rd overall behind 1981 and 1987. To claim 1st we would need 131 points, which has happened 4 times in the last 10 years - 2005, 2011, 2014 and 2015.

A chilly fall like 2010 or 2013 could drop 2016 down to about the same level as 2015, for a battle for 3rd and 4th spots. And if we have a really cold fall like we did in 2012, then that could push 2016's total down to about 5th overall.

That's all just speculation though. Another way of viewing this is to ignore calendar years, and to just look at the last 12 months instead:


Here the chart is shifted to show September-August, rather than January-December. And in that timeframe, the last 12 months have been the warmest ever recorded in Edmonton.

One thing that's interesting about this though, is that 2011-2012 and 2005-2006 come in as the previous 2nd and 3rd highest, even though those individual calendar years weren't particularly warm.

Here's the reason behind that:


2005 was a pretty unexceptional year, until a warm fall moved it into 9th place. And then 2006 was a very warm year, until a cool fall dropped it into 8th place. So individually they are at the bottom of the top 10, but together September 2005-August 2006 ranked 3rd.

2011-2012 are similar. 2011 was actually a very cold spring and summer, but a warm fall boosted it from below average to above the 75th percentile. And then 2012 was very warm - almost as warm as 2006 - until the very cool fall pushed it down to 19th place. But September 2011-August 2006 together ranked 2nd warmest.

So with all of that then, the last 12 months were the warmest September-August ever recorded. But our recent super El Niño is over, so we'll have to wait and see what fall 2016 brings.

Finally today, because there's so much data that I'm trying something new. Here is an interactive chart which will let you view the various years: