
For fun, here's the 3d chart of every precipitation event at the International Airport from the last two decades:

There's a prominent ridge in May-July where we typically get the bulk of our precipitation for the year, and 2016 was no exception. Beyond that though, this chart looks neat, but it's hard to read any actual information from it.
Total Precipitation
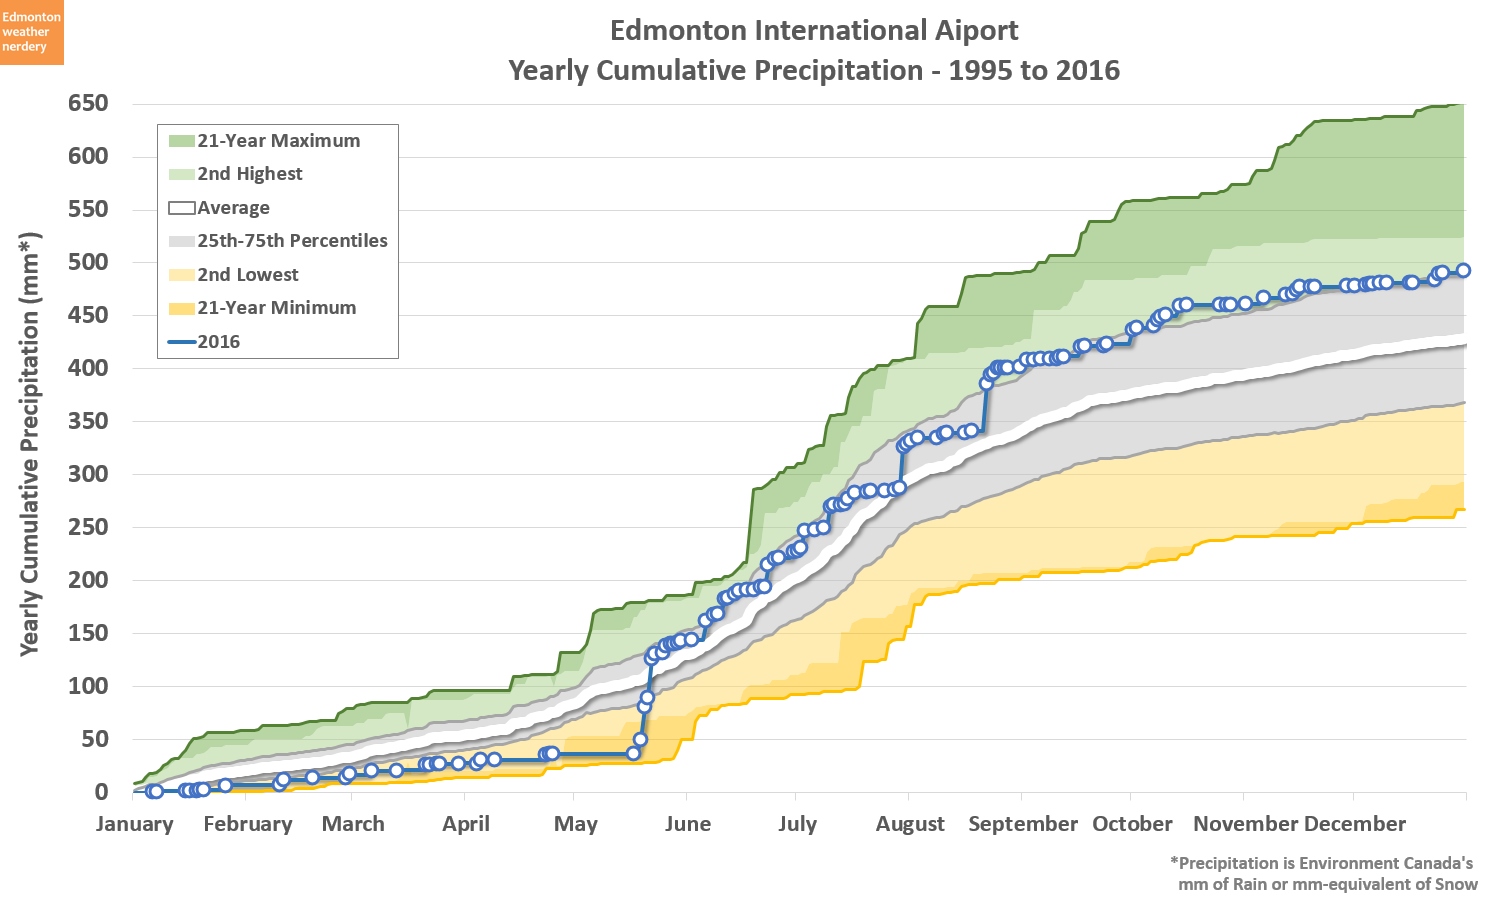
Here is how the precipitation piled up over the year: January-April were a very flat start to the year. Then a big storm on the May long weekend pushed 2016's total up above the average. It stayed there for the rest of the year, finishing at 496mm and right at the 75th percentile.

496mm of total precipitation is pretty high compared to recent years, putting it just below the 511mm of 2010. 2016 had the 2nd most precipitation since 1998, but 1998 is about the point where Edmonton's average precipitation dropped down a notch.
With the 5-Year average line on this chart, we can see that starting in around 1998~2000 Edmonton's precipitation fell from an average of about 475mm per year down to about 410mm. So 496mm in 2016 is high for recent years, but it would have been pretty typical from the 1960s-1990s.
Monthly Precipitation

Here we have the number of days with precipitation throughout the year, and from May through December things were a little bit above average. January through April were all low though, coming in below the 25th percentile.

In terms of the actual amounts of precipitation that we received though, April, May and October were the big surprises. April had almost no precipitation, which is unusual for the start of spring, while May and October both doubled their averages.
Total Snow

Now lets switch over to snow.
When we'd looked at Edmonton's history of snowfall, I'd said that I think it makes more sense to look at snowfall totals in terms of winters (the winter of 2015-2016, 1968-1969, etc), rather than as calendar years.
But since the calendar year just ended, we might as well look at the total snow for calendar-year 2016. Typically we get between 100-130cm, and in 2016 we got 78.2cm which is a little on the low side.
Monthly Snow

In terms of monthly snow, one strange thing about 2016 is that it's most snowy month was October.
That was partly because October was very snowy, but also because November, January, March and April were all well below average.
Snow on the Ground

Back in November I'd looked at when we usually get our first lasting snow. In terms of 2016 we can see that the large snow we got in October melted off, and it looks like the first lasting snow showed up in mid-November.
This chart is a bit problematic though, because this data is for the International airport, and in mid-November the airport had a big snowstorm which didn't really hit the city at all.
So here's the same chart, with an extra line added for Blatchford data:

And that's a little bit better, although it still shows "trace" amounts of snow in the last half of November. In reality things were basically snow-free in the city until the first week of December.
Unfortunately 2016 is the only year that I can correct like this, because Environment Canada's snow data for Blatchford is missing for 2007-2015. So I'll just continue to use data from the International, but I'll try to sanity-check it when possible.
Weekly Precipitation

To end things today, we're going to switch from snow back to total precipitation
Here the total precipitation for the year is broken down by week, and I think this one is interesting just because of how concentrated our precipitation was. About 40% of 2016's precipitation fell during just 3 weeks: one in May, one in July, and one in August. The other 49 weeks of the year were left to make up the other 60%.
No comments:
Post a Comment